The purpose of this document is to outline the basic steps to define the parameters and generate the TPA projections. The following sections are outlined in this document to assist the user in the required day-to-day tasks and represent the typical order of data entry and data generation.
The TPA is a complex planning tool that provides a complete and efficient processing plan based on the parameters established by the customer. Several profiles can be created for targets, hatch calendars and placements which allow the users to generate multiple projections to analyze the various scenarios. Products can be assigned to groups which allow one product to be placed and another product to be processed. For example, a product can be placed as a broiler straight run and then be processed as either a large bird or small bird.
The following diagram represents the basic flow of all of the components in the TPA process.
This section will guide the user to set up all prerequisites needed to operate TPA.
The Setup section contains the following components:
Next Available – will select the flock to be harvested if it exceeds the weight or max product age but select it at the next available target
Exceed Target – will select the flock to be harvested if it exceeds the weight or max product age even if it is going to exceed the target head.
Percent Deviation calculates the bird weight using all factors for the same age as the actual weight captured then it calculates the % deviation from the actual and applies the same deviation to the kill age projection.
Daily Weight Gain is recalculated based on the actual weight captured and then the new weight gain per day is used moving forward to create the kill age projection.
Processing Transaction and Field transactions – will always utilize the most current transaction closest to Harvest date.
Field Transactions Only – utilizes only field transactions
Processing Transaction Only – utilizes only processing transactions
Processing Transactions then Field Transactions – utilizes the processing transaction before factoring field transactions.
None – will bypass the logic and no weight will be used.
Farms will be set up during TIM implementation. The TPA tab is used as a scheduling tool. The following sections are outlined in the Farms section:
The General tab indicates the performance factors for the farm.

Weight Perf Factor – is a farm level calculation of weight performance based on historical factors. This value can be overridden. The value represents the farm’s performance against the average. For example, if the value here is 1.025, this farm has performed at 2.5% of the average or slightly better than average.
Beg Inactive Date – represents the date that the farm becomes inactive and is not available for placement.
End Inactive Date – represents the date that the farm is no longer inactive and is again available for placement.
Placement Area No – allows the user to define a placement area to be used in planning.
Field Weight Percent Accuracy – represents the accuracy of the weights taken at the farm as compared to the weights taken in the field.
Performance Factor Lock – when selected, this prevents the factors from being modified when the Calculate Factors function is generated. The factors may still be modified manually.
House Placement Restriction – indicates that the farm has a house placement restriction due to bio-security or another reason.
Placement Area Restriction – indicates that the farm has an area placement restriction due to bio-security or another reason.
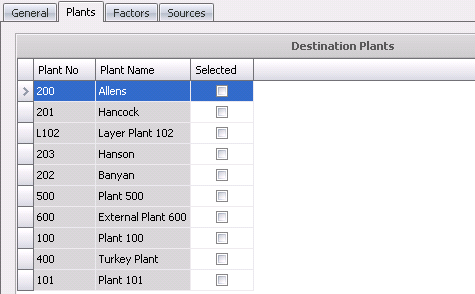
The Plant tab indicates the plants that the farm ships to.
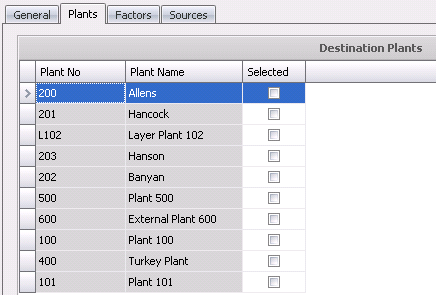
Plant No – indicates the plant that the farm ships to.
Plant Name – displays the name of the plant.
The Selected flag – indicates that the farm can be used to supply products to the plant that is selected. De-select the flag if the plant is no longer used.
The Factors tab allows the weight factor and the feed conversion factor to be defined by farm.
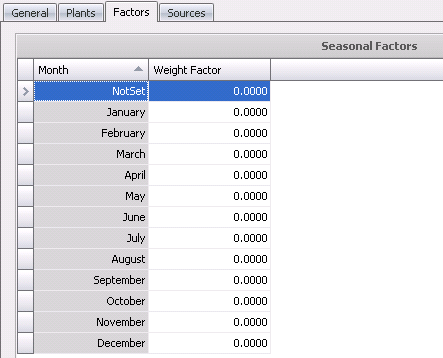
Month – displays the month that is being factored.
Weight Factor – displays the factor for the farm.
The Sources tab is used for two-stage broiler operations where birds are transferred from a brood farm to a grow farm, usually noted in turkeys. The source brood farms are defined on this tab for planning future placements.
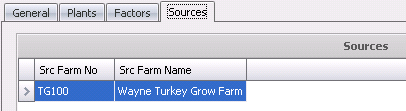
Src Farm No – indicates the source brood farm.
Src Farm Name – displays the name of the farm.
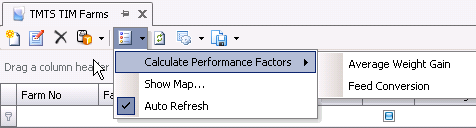
In the TMTS>TIM Farm Master List View, there is an option to calculate the Performance Factors.
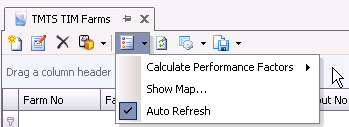
The dialog that is sorted by the Performance Factor will open.
TIM Houses are set up during TIM implementation. Weight and performance factors can be defined for the house or if there are seasonal factors, the factors can be determined by month.
The following components are outlined in the Houses section:
The General tab is used to enter the basic details for the house as well as the basics that are required for TPA. Weight and performance factors can be defined for the house or if there are seasonal factors, the factors can be determined by month.
In TMTS>TIM>Master Data, select Houses.
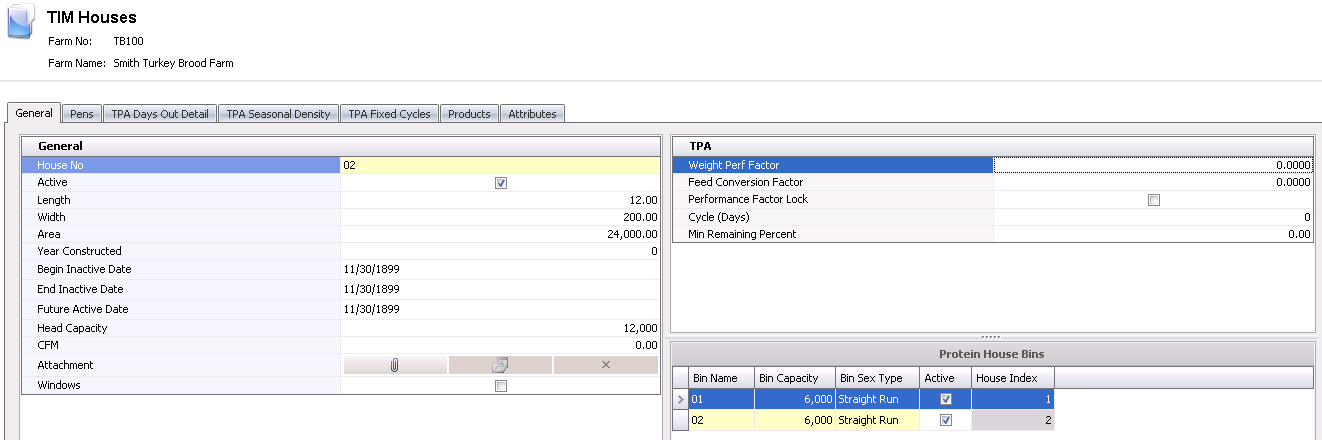
House No – defaults in from the New Record dialog box and displays the number of the house.
The house will default as Active. If the house becomes in active, de-select the flag.
Length – indicates the length of the house, and is an optional field. Length can be entered in feet, yards or meters depending on the unit of measure used by the division.
Width – indicates the width of the house, and is an optional field. Width is entered in feet, yards or meters depending on the unit of measure used by the division.
Area – is a calculated field that calculates the area in ft2 or m2 for the house. Area = Length x Width. Area is required for TPA Planning and is manually entered.
In the Year Constructed field, enter the year that the house was built, if required.
The Begin/End Inactive Date fields – are used if the house is going to be inactive for a period of time. If so, enter the date the house will become inactive in the Begin Inactive Date field, and the last day the house will be inactive in the End Inactive Date field.
Future Active Date – indicates the date the house will become active again. Enter the date, if applicable.
Head Capacity – defines the head capacity for the house. Head Capacity is used for planning purposes, and is required for TPA Planning.
The CMM or CFM field – is optional and indicates the measurement for airflow in cubic feet per minute, or cubic meters per minute.
In the Attachment field, any type of file can be attached. (Example: Word document, picture, music or video clip).
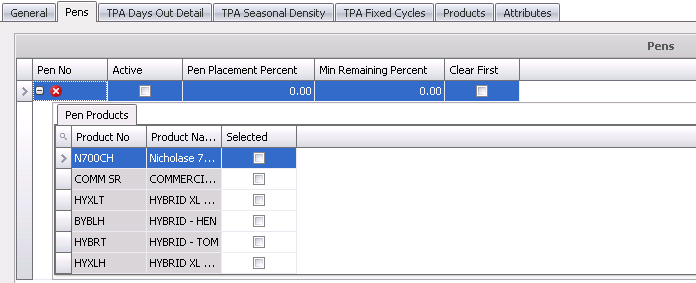
The Pens tab is used to specify the product that is to be placed in the pen.
Click
 to
add a new line.
to
add a new line.
In the Pen No field,
enter a unique code to identify the pen (alphanumeric, max 100 characters).
Click the child grid  in
the Pen No field for a list of pen products. Checking the Selected flag
will allow the pen to be utilized as any or all of the flags that
are selected. Pen products are identified in: General>General>Products>Animals>Poultry.
in
the Pen No field for a list of pen products. Checking the Selected flag
will allow the pen to be utilized as any or all of the flags that
are selected. Pen products are identified in: General>General>Products>Animals>Poultry.
Select the Active flag if the pen is currently active.
In the Pen Placement Percent field, enter the percentage of head placed.
Enter the Min Remaining Percent used to calculate the minimum remaining head that can be left in the pen when TPA projection is run.
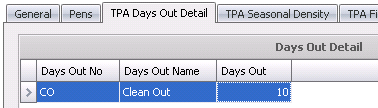
Days Out Detail defines the periods where the farms are not available for placement. Days Out numbers are user defined according to the requirements of the customer.
Click
to
add a new line detail.
From Days Out No, select the Days Out profile. Days Out must be set up prior in: Admin>Business>Poultry>BRIM/TIM>Days Out.
Days Out Name will default in and displays the name of the days out.
In the Days Out field, enter the number of days between the time the birds were sold until a new entity arrives.
The TPA Seasonal Density tab is used to enter the seasonal density and processing density for each product that can be placed or harvested in the house.
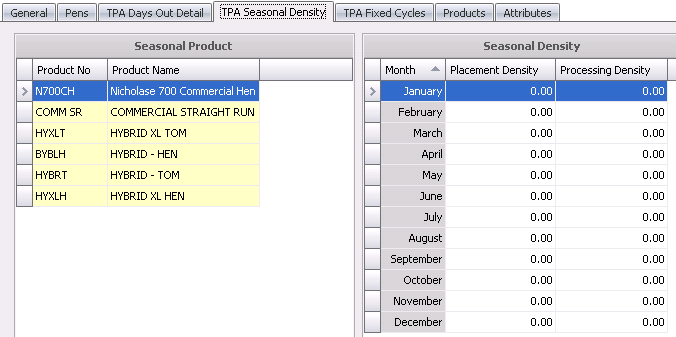
The fields in the Seasonal Product section will default in.
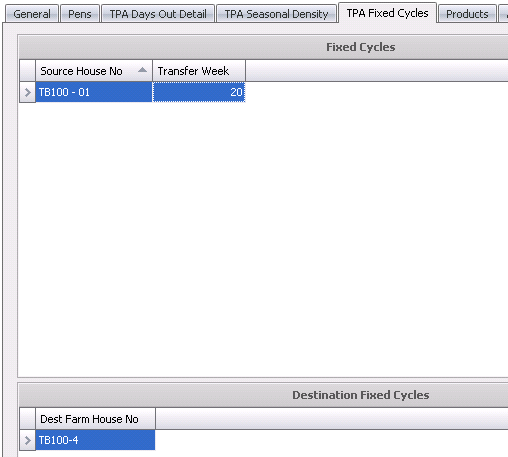
The TPA Fixed Cycles tab is only used for multi-stage operations where the birds are transferred from brood to grow. This option associates the brood and grow farms so that the sources for the entity can be defined.
Click
to add a new source house.
From the Source House No, select the house from where the product will be sourced.
In the Transfer Week field, enter the week that the product will be transferred.
In the TMTS>TIM Houses List View, there is an option to calculate the Performance Factors.
The dialog that is sorted by the Performance Factor will open.
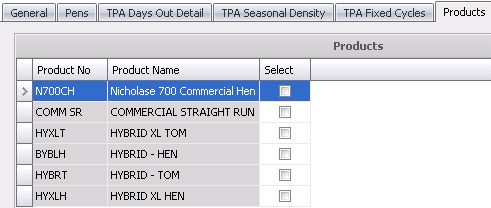
Products is an optional list of products to place in a house. Usually they are not selected unless the user wants to restrict the product that can be placed in the house. If selected, only the products selcted will be placed in the house. The information in the fields will default in.
Processing plants can be created as internal or external facilities. Plants are defined based on one cost center per plant. Address information is entered as well as latitude and longitude details for mapping. The child grids for each plant contain details related to line speeds, weight and down time.
In Admin>General>Definitions>Facilities, select Plants.
Select the button,
and a new line will appear. Required fields are outlined below.
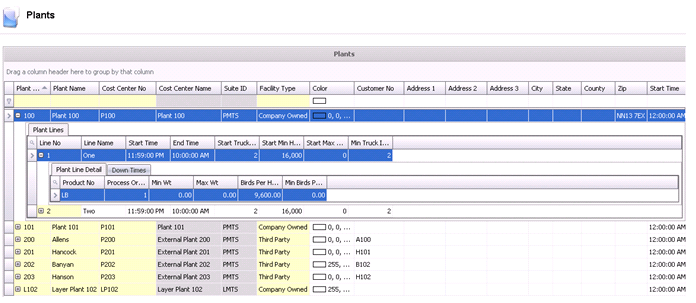
Enter the Plant No.
Enter the Plant Name.
Select the Cost Center No.
Select the Facility Type.
Select the Customer No if the plant is purchasing product.
In
the child grid ![]() , identify the Plant
Lines – optional.
, identify the Plant
Lines – optional.
Enter the Line No – optional 0 lines are not required for TPA.
Enter the Line Name.
Inside the Plant lines child grid, enter Plant line details and down times.
The age assignment will be used in the Weight Performance Curve. It will set the beginning and end age for the average weight gained per day as well as the % daily mortality.
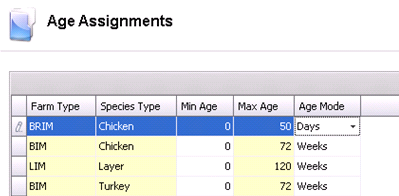
button.
The products must be established based on how the birds are processed. Products will have been set up during BRIM or HIM implementation. The most important product requirement is Target Age. Target Age is entered in days.
The Products section will outline two tabs:
In General>General>Products>Animals, select Poultry.
The General tab is the basic information related to the product type.
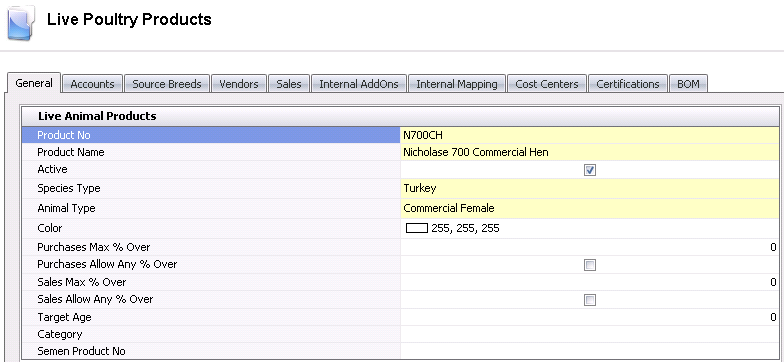
Required Fields:
Product No
Product Name
Species Type
Animal Type
Target Age
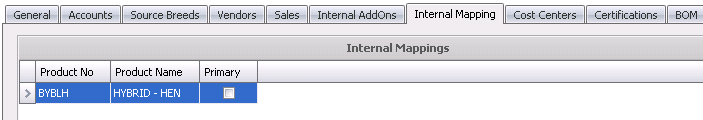
The Internal Mapping indicates the products that can be used interchangeably for the planning process. If the same product will be processed at different weights, then it is necessary to create a product for each weight group and map to the original product.
There are some tabs on the farms that must be completed for the TPA module to project processing schedules. Optionally, if the factors are determined by house or pen, the values can be defined at that level. If there are multiple plants and only certain farms can be processed at specified plants, this will need to be set up in the farm master. These fields must be completed for both BIM and TIM farms is applicable.
In TMTS>TIM>Master Data, select Farms.
Select the TPA tab. *Note: If no plants are defined here, every farm will be able to get processed at any available plant. Selecting the plant will restrict this farm to only the selected plants.
Plant No – indicates the plant that the farm ships to.
Plant Name – displays the name of the plant.
The Selected flag –
indicates that the farm can
be used to supply products to the plant that is selected. De-select
the flag if the plant is no longer used.
The TPA Master Data section contains the following components:
Profiles are used to create different processing scenarios. Profiles are created by species and have the required plants assigned to the profile. TPA profiles will be used to set up targets for the products and or different product groups. At least one profile is required; however you are able to create multiple profiles.
In TMTS>TPA>Master Data, select Profiles.
Create a new profile by clicking the
button.
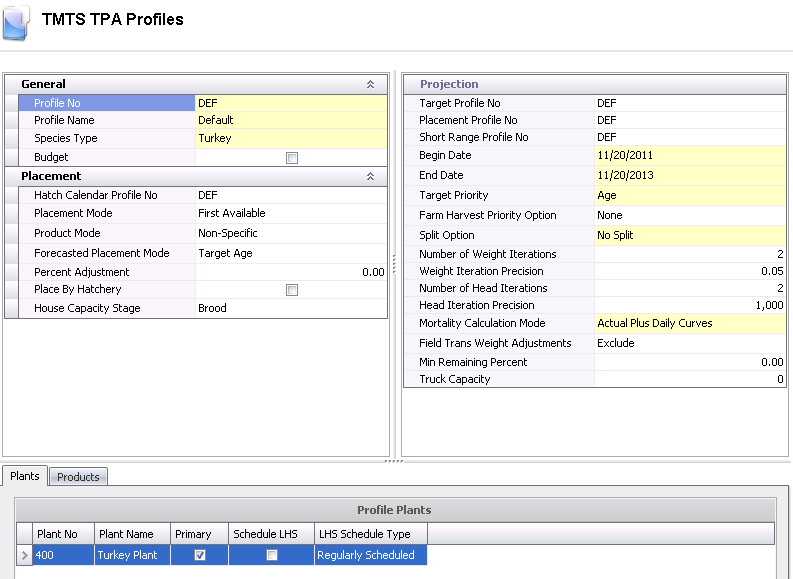
Required fields in the General section are:
Profile No
Profile Name
Species Type
Required fields in the Placement section are:
Hatch Calendar Profile No – used to identify the hatch calendar to use. This field is optional if the registry is set to Head Capacity mode.
Placement Mode – used to describe how the poults will be placed. Available options are First Available or Delivery Area.
Product Mode – used to determine how the product will be placed. Available options are: House Product Specific, Non-Specific, Previous Placement and Varying
Forecasted Placement Mode – used to determine the target parameter. Available options are Target Age or Target Weight.
Percent Adjustment – used to allow the system to adjust the placement numbers as needed to reach targets. This field is optional if placing to fill houses.
Place By Hatchery flag – if selected, the system will create the placements by hatchery.
House Capacity Stage – used to determine where the system will find the houses, size and capacity.
Required fields in the Projection section are;
Begin Date – date for projections to start.
End Date – date for projections to stop.
Target Priority – used to determine how head will be sold. Available options are: Age, Head Count, Weight or Weight Head Count.
Farm Harvest Priority option – used to tell the system how the farms will be selected for kill. Available options are:
Farm – Farms are prioritized bases on average weights highest to lowest. Houses and Pen are scheduled based on the heaviest average weight from highest to lowest.
Farm-House-Pen – Farms are prioritized bases on average weights highest to lowest and then houses and pens are scheduled in numerical order.
Split Option – select an option if farms or houses can have a split pick up for kill. Available options are:
No Split – Farms and or Houses will not have split pickup days.
Split Farms – The farm can have split pickup days.
Split Farms and Houses - At all Times – Farms and Houses can have split pickup days.
Split Farms and Houses - Contingency – Farms and Houses will have split pickup days as needed.
Number of Weight Iterations – used to enter the number of iterations the system is allowed to make in order to reach the projected weight.
Weight Iteration Precision – used to enter the spread in the weight that the system is allowed to make in order to reach the projected weight.
Number of Head Iterations – used to enter the number of iterations the system is allowed to make in order to reach the projected head count.
Head Iteration Precision – used to enter the variance allowed in the head count for system to reach the projected head count.
Mortality Calculation Mode – used to select the mode that the system will use to project mortality. Available options are:
Actual Plus Daily Curves – Mortality is calculated using actual data (Field Trans) plus projected daily mortality from the curve defined in weight performance profile to harvest day.
Seasonal Monthly Percent – Mortality is calculated from the weight performance profile (monthly statistics). No actual data is used. Mortality is entered in Products>Mortality tab.
Standard Daily Curves – Mortality is calculated using only the daily mortality curve defined in weight performance profile. Mortality is entered in the Product Performance Curves.
Field Trans Weight Adjustments – used to include or exclude from projections. Options are Include or Exclude.
Min Remaining Percent – used to calculate the minimum head that can be left in the house or pen when TPA Project is run.
Truck Capacity – used to enter the number of head the truck can haul. This number will be used in LHS to calculate crates.
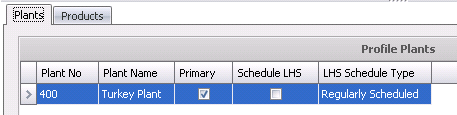
button. If the multi-plant
logic option will be used (where the products for this profile will
be capable of getting processed at multiple plants), all possible
plants must be specified here. At least one plant needs to be set
as the primary.
Once products and product groups have been created, it is time to specify the parameters to be used when calculating the projections.
There are six tabs in the Products section:
In TMTS>TPA>Master Data, select Products.
Click
the button and then click on
the drop-down arrow and select the product to be set up.
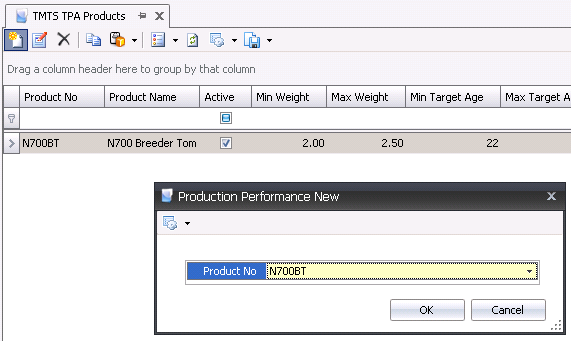
Specify the parameters to be used for calculating the projections.
The General tab is used to enter the basic details for the product profile.
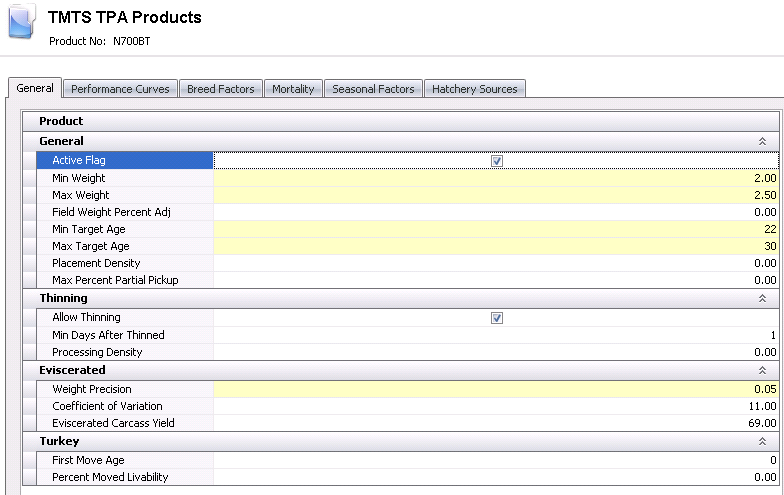
On the General section in the General tab, specify the Min and Max weight and ages to be used for not only the product but for all the products groups if they will be used. The Min and Max weight need to be a range wide enough to include the weights of all the product groups that will be used in the profile and on the targets. Required fields are:
Active Flag – select the box to make the profile active.
Min Weight – represents the minimum processing weight for the product. The value is entered in lbs or kgs depending on the unit of measure.
Max Weight – represents the maximum processing weight for the product. The value is entered in lbs or kgs depending on the unit of measure.
Min Target Age – indicates the age in days that is the minimum acceptable for processing.
Max Target Age – indicates the age in days that is the maximum acceptable for processing.
Placement Density – optional; only needed for TPA to plan placements.
In the Thinning section on the General tab, select the box to allow thinning in the event the farms use thinning in their houses. If there is a lockout period after a house has been thinned, specify the minium days required in the Min Days After Thinned row. The processing density also needs to be specified. This is what will be used to determine that a house needs to be thinned. Required fields are:
Allow Thinning – flag to allow thinning to be done.
Min Days After Thinned – enter the number of days after thinning that the next pickup can be completed.
Processing Density – entered in lbs or kgs to be processes (lbs/ft2 or kgs/m2).
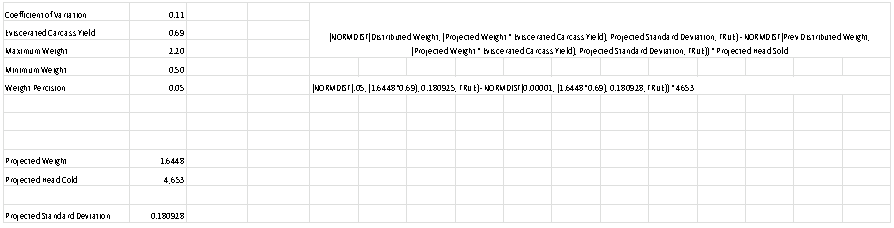
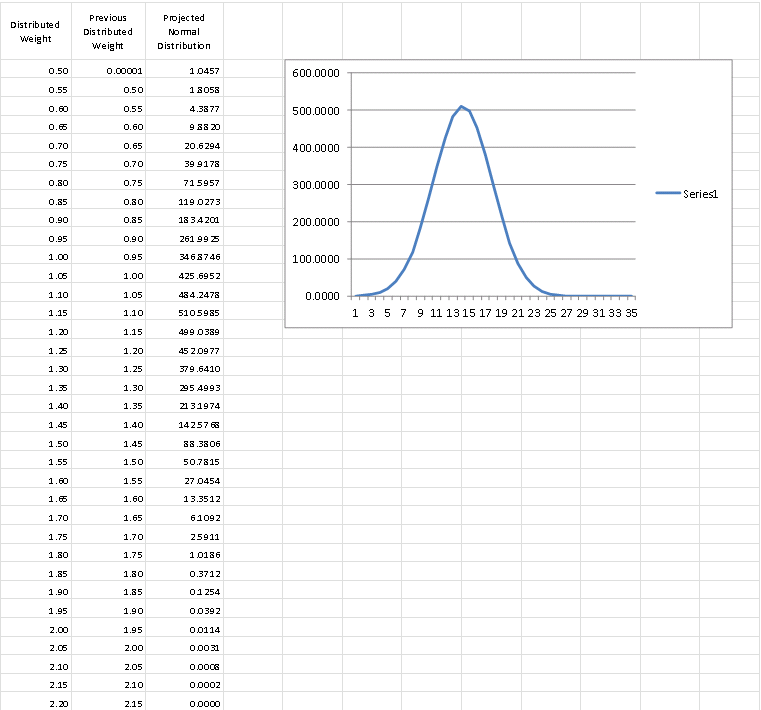
The Eviscerated section will be used to determine how the graphs will be displayed after a projection is calculated. If the company does not record the eviscerated weights and wants the graphs to display the whole birds put 100 in the Eviscerated Carcass Yeild. If the company will want to see the weights on the graph after evisceration then enter the percentage of the weight each bird will be. The co-efficient of variation is how the bell curve in the graphs will be shaped. By default, this is set to 11.00, however you can edit this to the number you want. The Min and Max weight in the Eviscerated section is the starting and ending points that will be used with displaying the bell curve of the projections in the graphs. Required fields are:
Weight Precision – defines the weight increment for the weights that are picked up in each planning loop.
Coefficient of Variation – statistic to analyze the standard deviation.
Eviscerated Carcass Yield – percentage of bird weight that remains after evisceration.
The Turkey section requires the following field:
First Move Age – represents the number of days where the bird is moved from brood to grow.
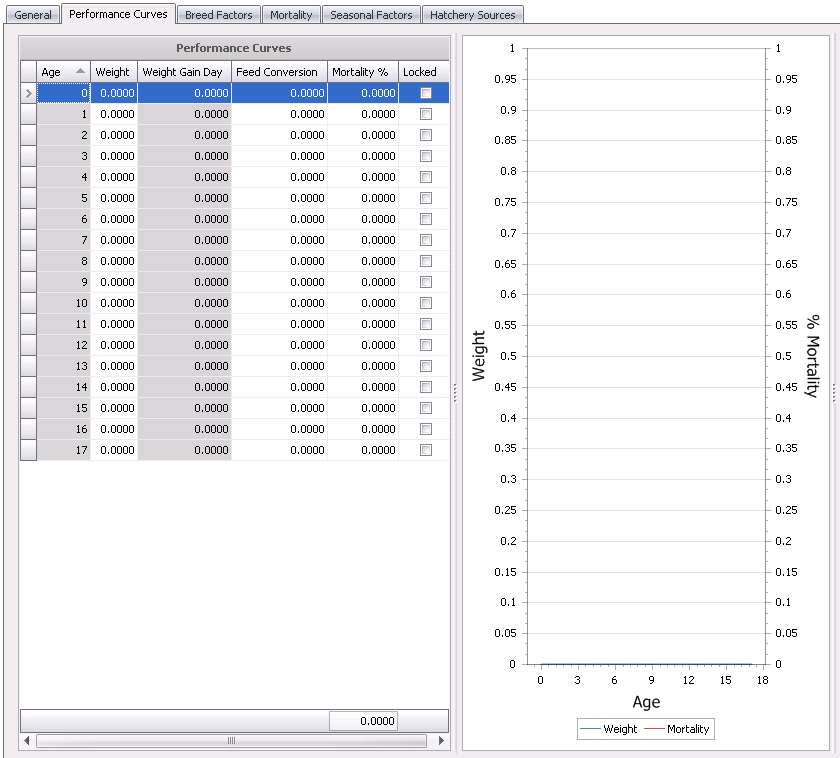
The Performance Curves is the location where the daily factors for weight, feed conversion and mortality are entered. The factors can be calculated from historical data or manually entered. There is an option to lock the factors for each day to prevent future modification to calculated statistics.
Once
the Product parameters have been set, it is time to calculate the performance
curves and factors to be used during the projections.
In TMTS>TPA>Master Data, select Products.
Open the product.
Once the calculation has completed, double-click on the product that was just calculated and click on the Performance Curves tab. If the curve is not feasible due to there not being enough history data in the program, the fields can be edited as desired.
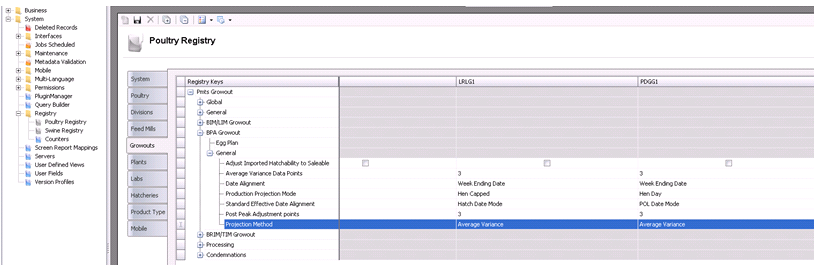
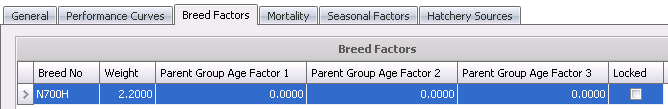
Breed Factors is an optional screen to enter any variables for the breeds assigned to the product. The breed factors are entered for the breed and there is also an option to enter the factors based on the age of the parent flocks. Parent Age Groups are set up in Registry>Plants>PMTS Plant>BRPA Plant>General>Parent Age Break 1, 2 and 3. There is an option to lock the factors so that they will not be updated with the TPA calculation option.
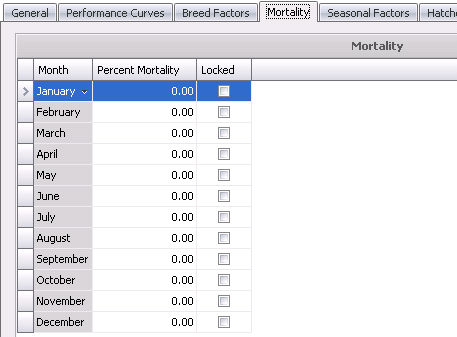
Mortality is an optional screen to enter monthly mortality to adjust processing head based on seasonality mortality factor. This screen is only needed if using Standard Mortality or if no actual mortality is found for the flock. There is an option to lock the factors so that the factors will not be adjusted when the TPA calculation option is generated. This screen should be completed if the Mortality Calculation Mode in the profile is set to Seasonal Monthly Percent - Mortality is calculated from the weight performance profile (monthly statistics). No actual data is used.
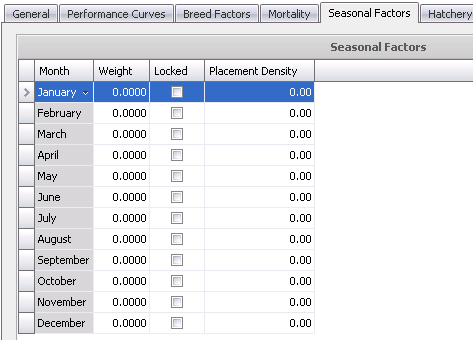
Feed conversion and placement density can be entered on a monthly basis to add a seasonality factor to the processing equation. The seasonal factor is based on the placement date. The factors can be locked so that the values are not updated when the TPA calculation option is generated.
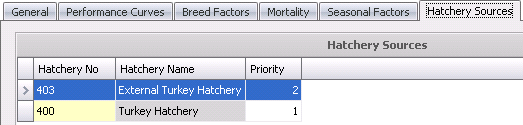
Hatchery Sources define the hatcheries that produce the product and assign a priority to the hatchery to establish the preferred sources.
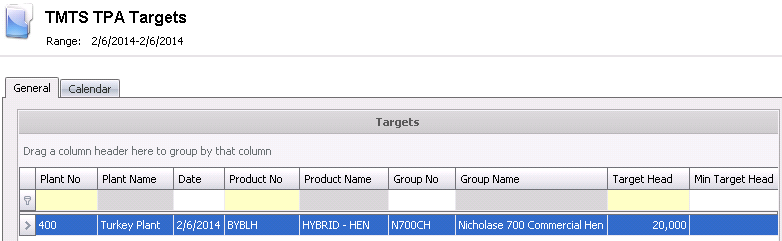
Targets will be used with the weight curves during the calculation to determine the day for each house to be processed. Targets are entered daily based on the Plant’s needs.
In TMTS >TPA>Planning, select Targets.
Click the
button.
Select the profile.
When
the TPA Target Screen appears, select
and then enter the required fields.
Plant No – determines the plant that the target is being established for.
Date – indicates the processing date for the target.
Product No – indicates the product for the target.
Target Head – required field that establishes the preferred target processing volumes.
Min Target Head – indicates the minimum targeted processing volume.
Max Target Head – indicates the maximum targeted processing volume.
Target Weight – represents the per bird target weight in lbs or kgs. The plan will try to match the birds with this weight to the processing targets.
Min Target Weight – represents the minimum per bird target weight in lbs or kgs. The plan will not select birds below this weight.
Max Target Weight – represents the maximum per bird target weight in lbs or kgs. The plan will not select birds above this weight.
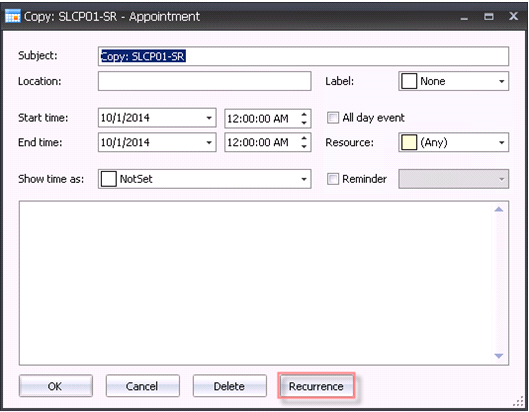
In the Appointment dialog box, select Recurrence.
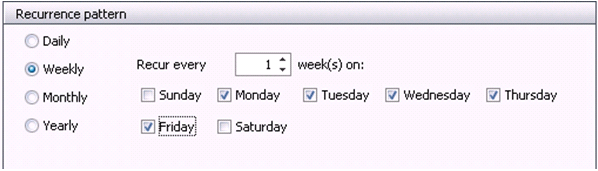
In the Recurrence Pattern box, select Weekly.
Select the day of the
week that the plant needs the product.
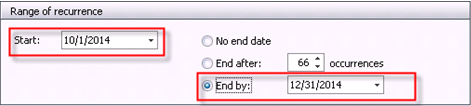
In the Range of recurrence box, select the Start date – the first date after the date you are copying.
Select the End by date – the date that targets need to stop.
Select `OK` and the range will be copied.
The TPA Projections section is comprised of the following components:
The Short Range Forecast is based on actual flocks that have been placed on the TIM Farm. Once the planned kill schedule has been calculated, the user may modify the data as required. Posting the short range is used for FDSA purposes.
Before Short Range can be calculated, a base or starting point for the short range must be created. This can be done by a manual entry or by using the import feature. These methods are only done the first time a Short Range is created.
In TMTS>TPA>Projections select Short Range.
In
the Short Range main
index, click to
create a new record.
In the Profiles dialog box, select the profile from the Profile No drop-down menu and then click 'OK'.
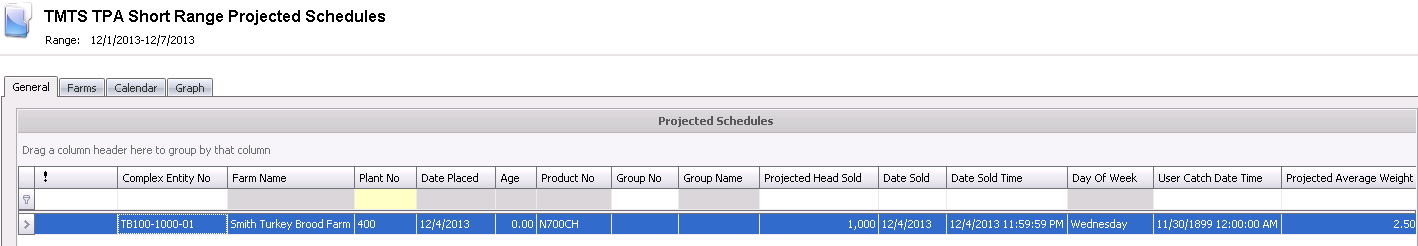
In the
Short Range Projected Schedules screen, click the
drop-down menu and select `Default` to add a new line. The Projected
Entity List will appear.
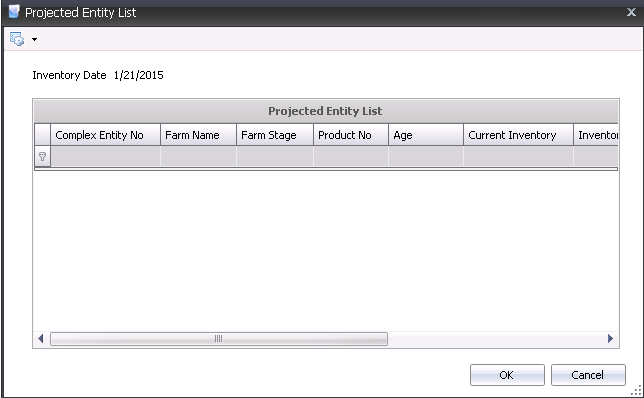
From the entity list, select the row to highlight the entity or select multiple entities by holding the Ctrl key down while selecting the entities.
Click 'OK' and entities will be moved to the Projected Schedule screen.
Save and close the record. The record will be moved to the Short Range main screen.
The import function builds the kill schedule based on processing trans. The import function matches the kill schedule to the actual kills allowing you to start with the new kill dates.
In
the Short
Range main index, click the  button and select 'Import Processing Transactions'.
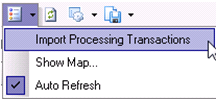
In the Import Processing Transactions dialog box, from Profile No, select the required profile.
Select the Begin Date and End Date and then click 'OK'.
The processing records for that time period will be brought into Short Range as the starting point for future kill schedules.
The Short Range Projection is based solely on actual placements and will only plan processing for those placements. The Short Range screen must have at least one entry before the kill schedule can be calculated.
In TMTS>TPA>Projections, select Short Range.
In the Short Range main index,
click the Calculate  button to calculate the kill schedule.

From Profile No, select the profile that the processing plan will be saved to.
Select the Target Profile No that will determine the targets for the projection.
Select the Placement Profile No that will be used for the calculation.
Enter the Begin Date for the projected processing plan. The Begin Date will be the first date that birds are processed.
Enter the End Date for the projected processing plan. The End Date will be the last date that birds are processed.
Select the Target Priority to determine the method that the birds are selected. Options are Age or Weight Head Count.
Select the Farm Harvest Priority Option to determine how the farms are picked up and delivered to the processing plant. Available options are:
Farm – Farms are prioritized based on average weight from highest to lowest. Houses and pens are scheduled based on the heaviest average weight from the highest to lowest.
Farm-House-Pen – Farms are prioritized based on average weight from highest to lowest. Houses and Pens are then scheduled in numerical order.
None – Houses and Pens are scheduled from highest to lowest weight (not farm specific)
Select a Split Option to determine if or how placements can be split. Available options are:
No Split – Placements will not be split.
Split Farms – elect this option if the placement to the farm can be made in split over more than one processing date.
Split Farms and Houses at all Times – Farms and Houses can be split over more than one processing date.
Split Farms and Houses - Contingency – arms and Houses will have split delivery days as needed.
Enter a Number of Weight Iterations to determine the number of loops the system will make to reach the desired target for weights.
Enter the Weight Iteration Precision to define the weight increment for the weights that are picked up in each processing loop.
Enter a Number of Head Iterations to determine the number of loops the system will make to reach the desired target for head counts.
Enter the Head Iteration Precision to define the head increment for the head that are picked up in each processing loop.
Select the Mortality Calculation Mode to determine how mortality will projected. Available options are:
Actual Plus Daily Curves – Mortality is calculated using actual data (field transactions) plus Projected Daily Mortality from the curve defined in weight performance profile to harvest day.
Seasonal Monthly Percent – Mortality is calculated from weight performance profile (monthly statistics). No actual data is used.
Standard Daily Curves – Mortality is calculated using the daily mortality curve defined in the weight performance profile.
Enter a Min Remaining Percent to calculate the minimum head that can be left in the house or pen when TPA Projections is ran.
Enter a Truck Capacity – optional field used to define the number of birds that can be hauled on the truck. This number will be used in LHS to determine the number of crates to be used.
Click 'OK' and the Short Range will be created.
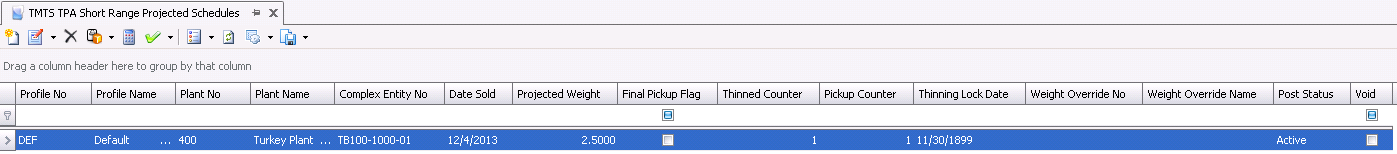
This section is comprised of the following tabs:
Adjustments can be made as needed after the short range has been created. *Note: System generated short range. Once the week has been posted changes are not allowed unless the entire week is un-posted. Then the system will start with the last fully posted week and then recalculate from that week forward.
 button.
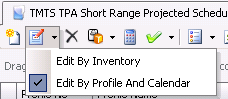
The General tab contains the data that is relevant for the process of creating a kill schedule.
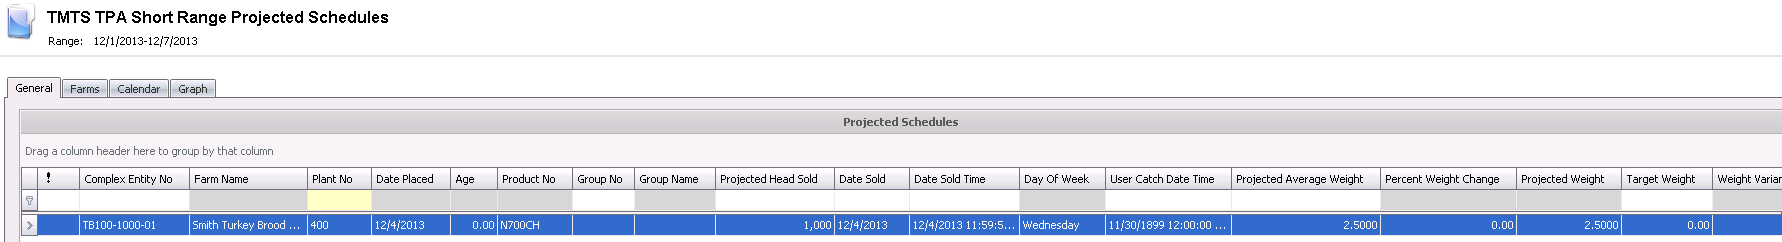
Processing Order Sequence – displays the order that the entities are processed, and can be edited if required.
Complex Entity No – identifies the Farm-Entity-House-Pen No's, and can be edited if required.
Farm Name – displays the name of the farm.
Plant No – identifies the processing plant that the birds will be going to, and can be edited if required.
Date Placed – identifies the date the birds were placed at the farm.
Age – identifies the age of the bird when sent to the processing plant.
Product No – identifies the product being processed
Group No – indicates the group if the product target was assigned to a user defined group, which allows the products to be grouped together for processing. For example, a group may be all products within a certain weight range. This field can be edited if required.
Group Name – displays the name of the group.
Projected Head Sold – identifies the number of head going to the processing plant, and can be edited if required.
Head Placed – represents the head placed for the entity.
Head Inventory – displays the number of head at the farm, and can be edited if required.
Date Sold – identifies the date the birds are targeted to be sold, and can be edited if required.
Date Sold Time – displays the date and time that the entity was sold
Day of Week – displays the day of the week that the entity was sold.
Projected Average Weight – displays the projected average weight for the entity being processed. This field can be edited if required.
Target Weight – displays the target weight per age as defined in Products>Performance Curves. This field can be edited if required.
Weight Variance – displays the difference between the Projected Average Weight and the Target Weight.
Final Pickup – this flag should be selected if this is the final pickup for the entity.
Final Farm Pickup – this flag should be selected if this is the final pickup for the farm.
Record Change – should be selected when records are modified after the initial projection.
The User Override – this flag should be selected if true records will not be deleted when running projections.
Record Type – identifies the type of record.
Thinned Counter – displays the number of times the entity has been thinned. This field can be edited if required.
Processing Density – indicates the desired lbs/ft2 or kgs/m2 to be processed.
Target Head Count Steps – identifies the method in which the birds are selected.
Pickup Counter – identifies the number of pickups for the entity.
Date Feeders Off – displays the date the feeders were turned off, and can be edited if required.
Date Feeders Raised – displays the date the feeders were raised, and can be edited if required.
Catch Crew – identifies the crew catching the birds is LHS is being used.
Catch Date Time – displays the date and time the birds are to be caught.
User Catch Date Time – an optional field that informs the optimizer component that Short Range Projected Schedules line must be caught at a certain time (Start).
Unit Price – displays the per unit price of the birds sold.
Memo – system generated note field that recaps the statistics and selection process for the entity.
Error Reason – identifies the reason for error in selecting the entity.
Notes – a field to enter further information regarding the entity selection.
The Farms tab is a view of the short range by Entity with added LOE information. No editing is allowed on this screen except for the Processing Sequence.

The Calendar view displays the short range in a calendar format. Entities can be moved by using the drag and drop option. There are options to view the calendar in daily, weekly or monthly views.
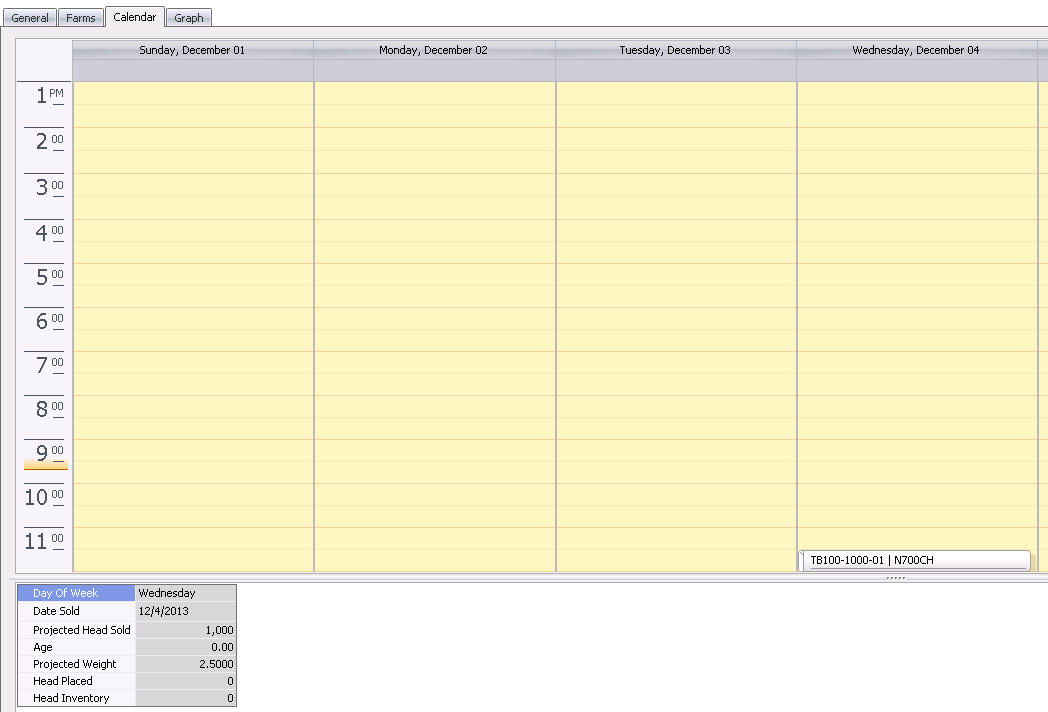
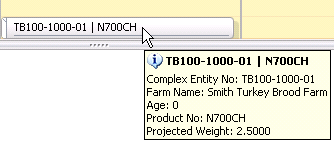
By Hovering over an Item, the basic information can be viewed in a bubble.
Items can also be relocated by dragging and dropping the item to a new day or time.
By right-clicking on the item and selecting 'Copy', the item can be duplicated by using the 'Recurrence' option.
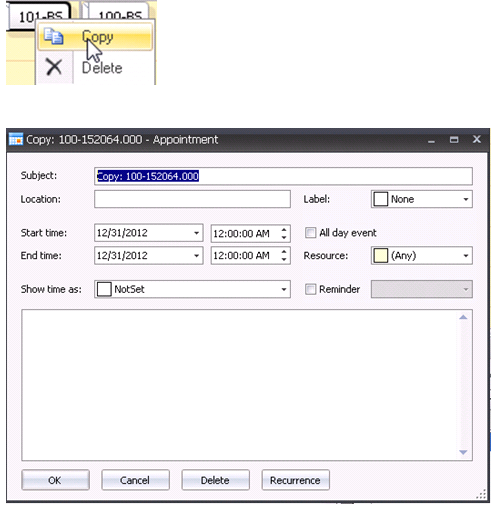
In the Appointment dialog box, select 'Recurrence'.
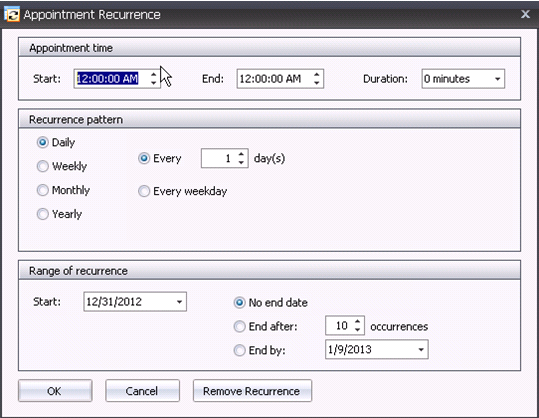
In the Recurrence Pattern selection, select how the entry is to reoccur. Available options include: Daily, Weekly, Monthly or Yearly.
In the Range of Recurrence section, enter the Start Date.
Select the End Date. Available options are: No end date, End after (x amount of occurrences), or the End by date.
Click 'OK' and then in the Appointment dialog box, click 'OK' again.
Save and close the record.
*Note:
The new records
will be the same as the record used to create the occurrences; the only
difference will be the dates.
The Calculations section is comprised of the following two components:
This includes all of the flocks with the following criteria:
Last Date Sold Between Date Range specified in the dialog
Must be closed or inactive
Not flagged with BRPA excluded
Plant specified in the farm (primary plant) will match the plant entered in the dialog
Optionally match to a product
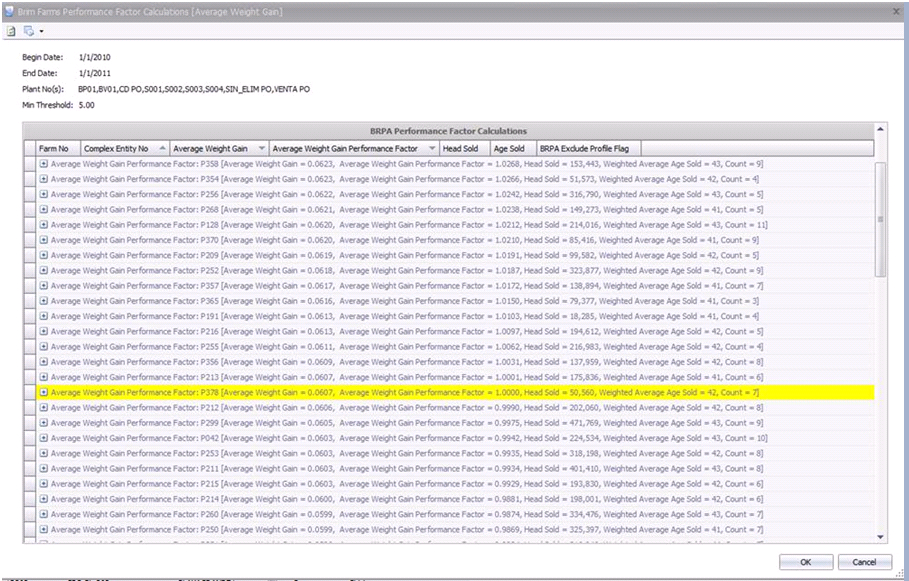
The filters above are used to get the Processing Transactions to calculate the Average Weight and divide by Age to get Average Weight Gain. If the calculation is for feed conversion, all the feed deliveries for the flocks that matched the criteria above will also appear.
The threshold is used to exclude the top and lowest percent to calculate the median.
Median Average Weight Gain gets a Performance Factor of 1, and the rest gets below or above 1.
Farm: data is grouped by Farm
Houses: data is grouped by Houses.
Performance Types:
Avg Weight Gain = Total Weight Sold / Age Sold
Feed Conversion = Total Feed Delivered / Total Weight Sold
Min Threshold = percentage of lower and upper values ignored by calculation
Dialog will open and is sorted by the Performance Factor.
Performance Factor Calculations are based on Average Weight Gain or Feed Conversion divided by the median.
The Median will have Performance Factor = 1 (Marked Yellow) and this is used to get the other Performance Factors.