short range

The Short Range Forecast is based on actual flocks that have been placed
on the BRIM Farm. Once the planned kill schedule has been calculated,
the user may modify the data as required.
There are two types of projections available to BRPA.
- Short Range
– Processing plan is determined based on actual placements. Prior
to creating a Short Range, BRIM
Entities must be created.
- Long Range
– Processing plan is determined based on actual and project placements.
Prior to creating a Long Range, BRIM
Entities and Movements
must be created.
The following components are outlined related to creating a Short Range:
Create an Initial Short
Range
Before Short Range can be calculated, a base or starting point for
the short range must be created. This can be done by a manual entry or
by using the import feature. These methods are only done the
first time a Short Range is created.
The initial short range can be created by one of two ways:
Manual Entry
- In BMTS>BRPA>Projections
, select Short Range.
In the Short
Range main index, click  to create
a new record.
In the Profiles dialog box, select the profile
from the Profile No drop-down
menu and then click 'OK'.
In the Short Range Projected Schedules screen,
click the drop-down menu to add a new line and
select from one of the following options: `Default` or `Breeder`.
Selecting Breeder will allow the user to enter each individual field.
Select Default to view the Projected Entity List.
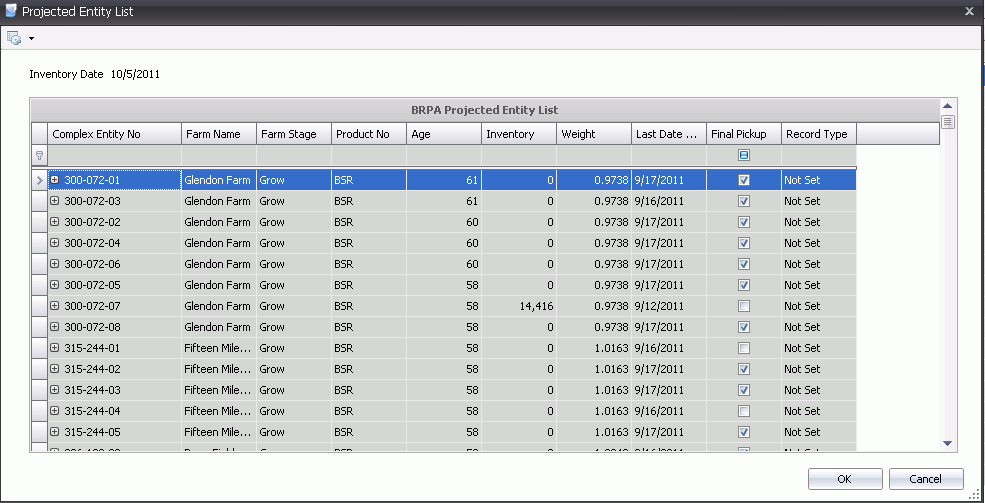
- From the entity list, select the row to highlight
the entity or select multiple entities by holding the Ctrl key down
while selecting the entities.
- Right-click 'and select Add/Move to move the entities
to the Projected Schedule screen.

- Save and close the record. The record will be
moved to the Short Range main screen.
Import Short Range
- In the Short
Range main index, click the
 button
and select 'Import Processing Transactions'.

- In the Import Processing Transactions dialog box,
from Profile No, select the
required profile.
- Select the Begin
Date and End Date and
then click 'OK'.
- The processing records for that time period will
be brought into Short Range as the starting point for future kill
schedules.

Calculate the Short Range
The Short Range Projection is based solely on actual placements and
will only plan processing for those placements. The Short Range
screen must have at least one entry before the kill schedule can
be calculated.
- In BMTS>BRPA>Projections,
select Short Range.
In the Short
Range main index, click to calculate
the kill schedule.
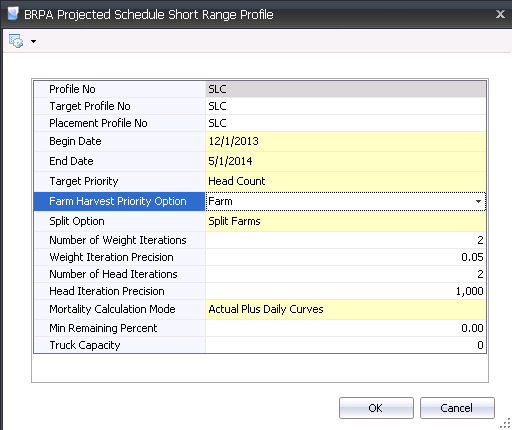
- From Profile
No, select the profile that the processing plan
will be saved to.
- Select the Target
Profile No that will determine the targets for the projection.
- Select the Placement
Profile No that will be used for the calculation.
- Enter the Begin
Date for the projected processing plan. The Begin Date
will be the first date that birds are processed.
- Enter the End
Date for the projected processing plan. The End Date will be
the last date that birds are processed.
- Select the Target
Priority to determine the method that the birds are selected.
Options are Age or Weight Head Count.
- Select the Farm
Harvest Priority Option to determine how the farms are picked
up and delivered to the processing plant. Available options are :
Farm - Farms
are prioritized based on average weight from highest to lowest.
Houses and pens are scheduled based on the heaviest average weight
from the highest to lowest.
Farm-House-Pen
- Farms are prioritized based on average weight from highest to
lowest. Houses and Pens are then scheduled in numerical
order.
None - Houses
and Pens are scheduled from highest to lowest weight (not
farm specific)
- Select a Split
Option to determine if or how placements can be split. Available
options are:
No Split -
Placements
will not be split.
Split Farms
- Select this option if the placement to the farm can be made
in split over more than one processing date.
Split Farms and
Houses at all times - Farms and Houses can be split
over more than one processing date.
Split Farms and
Houses - Contingency
- Farms and Houses will have split delivery days as needed.
- Enter a Number
of Weight Iterations to determine the number of loops the system
will make to reach the desired target for weights.
- Enter the Weight
Iteration Precision to define the weight increment for
the weights that are picked up in each processing loop.
Enter a Number
of Head Iterations to determine the number of loops the
system will make to reach the desired target for head counts.
Enter the Head
Iteration Precision to
define the head increment for the head that are picked up in each
processing loop.
Select the Mortality
Calculation Mode to determine how mortality will projected.
Available options are:
Actual Plus
Daily Curves
- Mortality is calculated using actual data (field transactions)
plus Projected Daily Mortality from the curve defined in weight
performance profile to harvest day.
Seasonal Monthly
Percent - Mortality is calculated from weight performance
profile (monthly statistics). No actual data is used.
Standard Daily
Curves - Mortality is calculated using the daily
mortality curve defined in the weight performance profile.
- Enter a Min Remaining
Percent to calculate the minimum head that can be left in the
house or pen when BRPA Projections is ran.
Enter a Truck
Capacity to define the number of birds that can be hauled on
the truck. This number will be used in LHS to determine the number
of crates to be used.
Click 'OK' and the Short Range will be created.
View and Edit the Short Range
Adjustments can be made as needed after the short range has been
created. *Note: Entities
that have a Positive health status will be displayed in bold. Positive
entities will be displayed with a different color bubble (one color for
End of Day and another color for End of Week).
There are four components in the editing process:
- In the Short Range Projected Schedules main screen,
click the down arrow on the
 button.

- Select the type of view for the screen. Once the
"Edit By" option has been selected, the screen will
automatically open to that view. This view can be changed at any time.
General
The General tab contains the data that is relevant for the process of
creating a kill schedule.

- Complex Entity
No identifies the Farm-Entity-House-Pen No's, and can
be edited if required.
- Farm Name
displays the name of the farm.
- Plant No
identifies the processing plant that the birds will be going to, and
can be edited if required.
- Date Placed
identifies the date the birds were placed at the farm.
- Age identifies
the age of the bird when sent to the processing plant.
- Product No
identifies the product being processed
- Group No indicates
the group if the product target was assigned to a user
defined group, which allows the products to be grouped together for
processing. For example, a group may be all products within a certain
weight range. This field can be edited if required.
- Group Name
displays the name of the group.
- Date Sold
identifies the date the birds are targeted to be sold, and can be
edited if required.
- Date Sold Time displays the date and time
that the entity was sold
- Day of Week
displays the day of the week that the entity was sold.
- Projected Head
Sold identifies the number of head going to the processing
plant, and can be edited if required.
- Head Placed
represents the head placed for the entity.
- Head Inventory
displays the number of head at the farm, and can be edited if required.
- Projected Average
Weight displays the projected average weight for the entity
being processed. This field can be edited if required.
- Percent Weight Change will
default in and indicates the percentage of any weight change.
- Target Weight
displays the target weight per age as defined in Products>Performance
Curves. This field can be edited if required.
- Weight Variance
displays the difference between the Projected Average Weight and the
Target Weight.

- Select the Final
Pickup Flag if this is the final pickup for the entity.
- Select the Final
Farm Pickup Flag if this is the final pickup for the farm.
- Select the Record
Changed when records are modified after the initial projection.
- Select the User
Override flag if true records will not be
deleted when running projections.
- BRPA Weight Overrides will display
any...
- Record Type
identifies the type of record.
- Target Head Count
Steps identifies the method in which the birds are selected.
- Pickup Counter
identifies the number of pickups for the entity.
- Thinned Counter
displays the number of times the entity has been thinned. This
field can be edited if required.
- Processing Density
indicates the desired lbs/ft2 or kgs/m2 to be processed.
- Next Day Processing
Density indicates the desired lbs/ft2 or kgs/m2 to be processed
the next day.
- Unit Price
displays the per unit price of the birds sold.
- Date Feeders
Off displays the date the feeders were turned
off, and can be edited if required.
- Date Feeders
Raised displays the date the feeders were raised, and
can be edited if required.
- User Catch Date
Time is an optional field that informs the optimizer component
that Short Range Projected Schedules line must be caught at a certain
time (Start).

- Catch Crew identifies
the crew catching the birds is LHS is being used.
- Catch Date Time
displays the date and time the birds are to be caught.
- Processing Order
Sequence displays the order that the entities are processed,
and can be edited if required.
- Memo is
a system generated note that recaps the statical and selection process
for the entity.
- Error Reason
identifies the reason for error in selecting the entity.
- Notes
is a field to enter further information regarding the entity selection.
Farms
The Farms tab is a view of the short range by Entity with added LOE
information. No editing is allowed on this screen except for the
Processing Sequence.

- Processing Order
Sequence displays the order in which the entities will be processed.
Farm No
identifies the farm being processed.
Farm Name
displays the name of the farm.
Entity No
identifies the entity being processed.
Plant No
identifies the Plant doing the processing.
Plant Name
displays the name of the plant.
Date Sold
identifies the final sold date of the entity.
Catch Date
identifies the date the entities will be caught.
Projected
Head Sold identifies the number of head going to the processing
plant.
Average Weight
displays the average processing weight for the entity.
Number of
Trucks indicates the number of trucks used to haul the entity
to the processing plant.
Travel Time
Minutes displays the number of minutes from the farm to the
processing plant.
LOE Head Sold
displays the total number of birds sold from the entity.
LOE Average
Weight displays the total weighted average weight of the birds
sold from the entity.
- LOE Average Age
displays the average age of the birds sold from the entity.
- LOE Weight /
Area displays the total weight from all houses on that farm
(when multiple houses were used for a particular entity) divided by
the total area of all the houses. This lets you know what the processing
density was, based on the weights recorded during processing.
- The LOE
Final Farm Pickup flag will be checked for the final pickup
for the entity at the farm.
Calendar
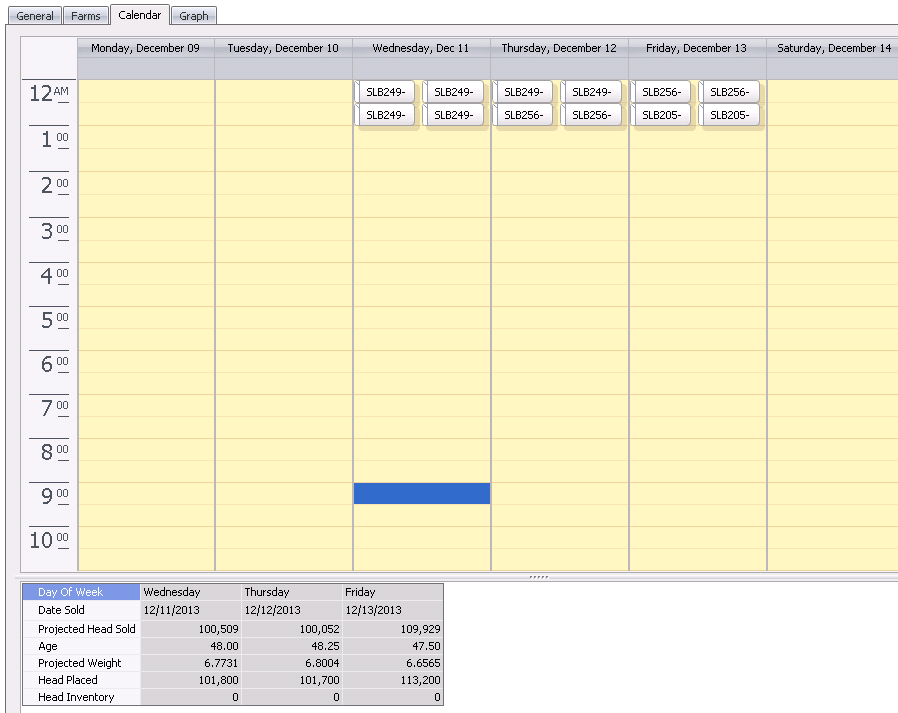
The Calendar view displays the short range in a calendar format. Entities
can be moved by using the drag and drop option. There are options to view
the calender in daily, weekly or monthly views.
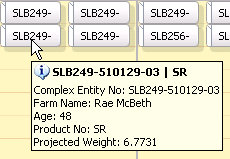
- By Hovering over an Item, the basic information
can be viewed in a bubble.
- Items can also be relocated by dragging and dropping
the item to a new day or time.
By right-clicking on the item and selecting
'Copy', the item can be duplicated by using the 'Recurrence'
option.

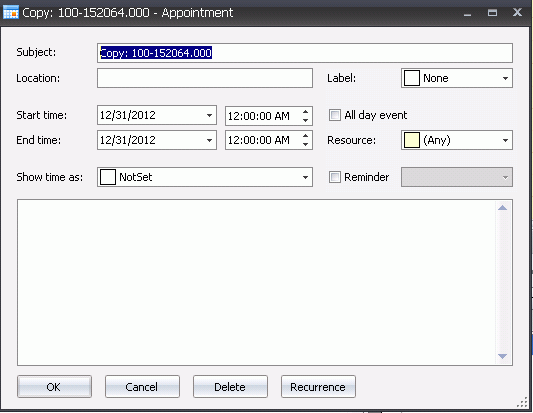
- In the Appointment dialog box, select 'Recurrence'.
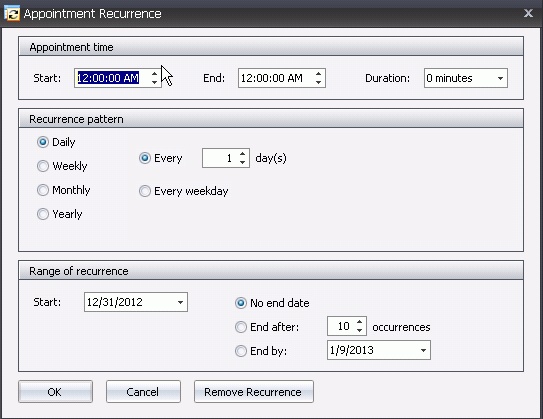
- In the Recurrence
Pattern selection, select how the entry is to reoccur. Available
options include: Daily, Weekly, Monthly or Yearly.
In the Range
of Recurrence section, enter the Start
Date.
Select the End
Date. Available options are: No end date, End after (x
amount of occurrences), or the End by date.
Click 'OK' and then in the Appointment dialog
box, click 'OK' again.
Save and close the record.
*Note:
The new records will be the same as the record used to create the
occurrences; the only difference will be the dates.
Graph
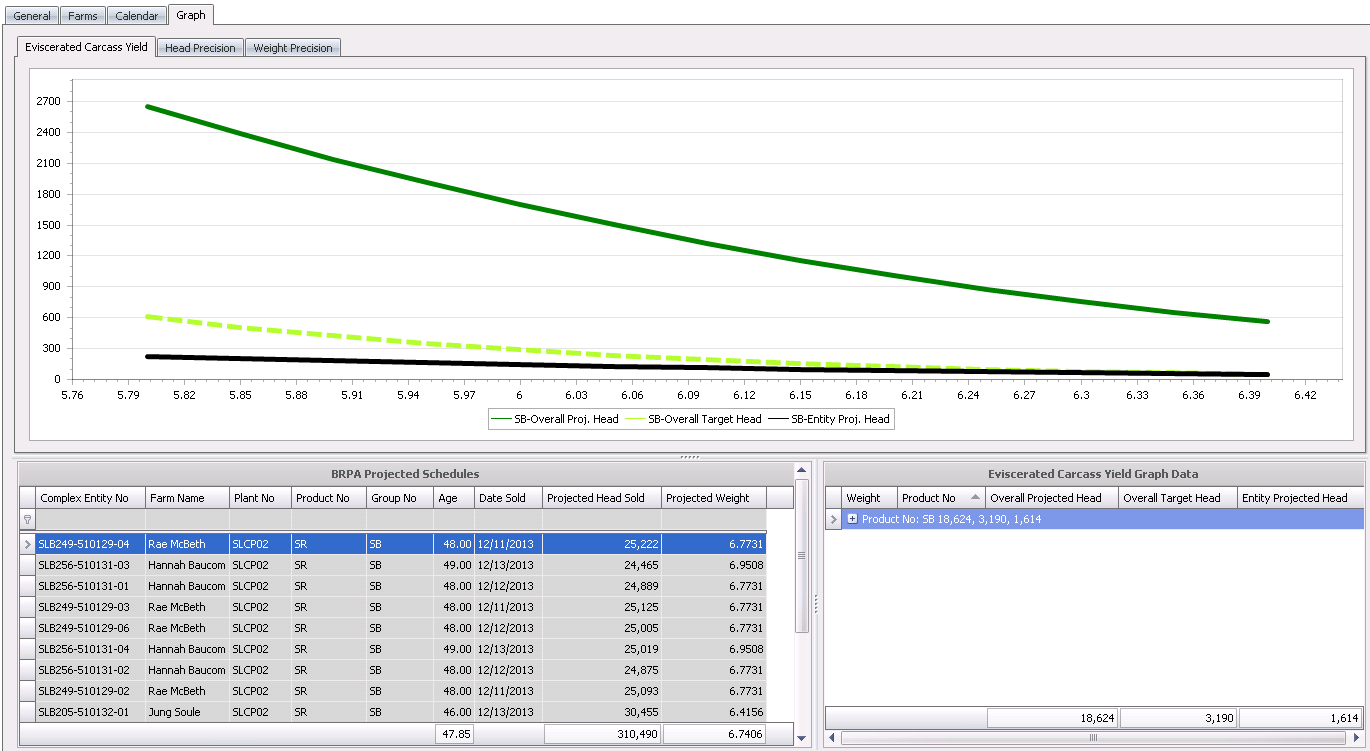
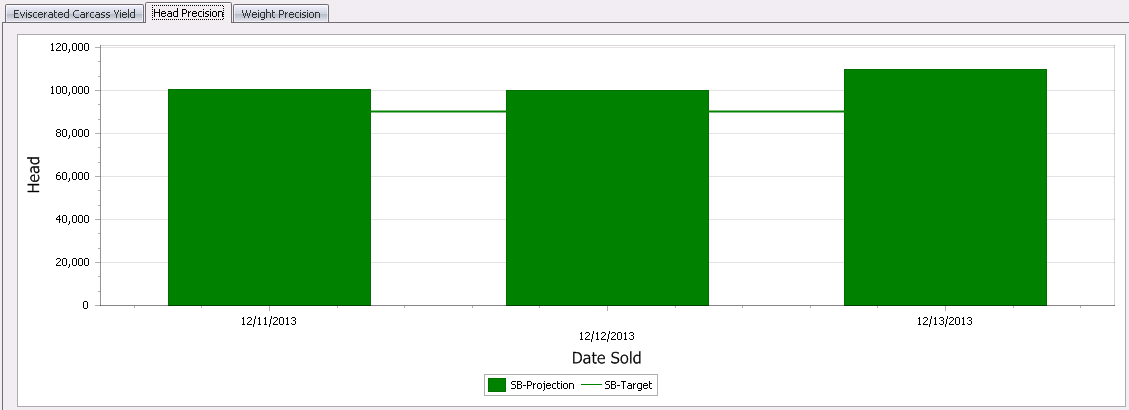
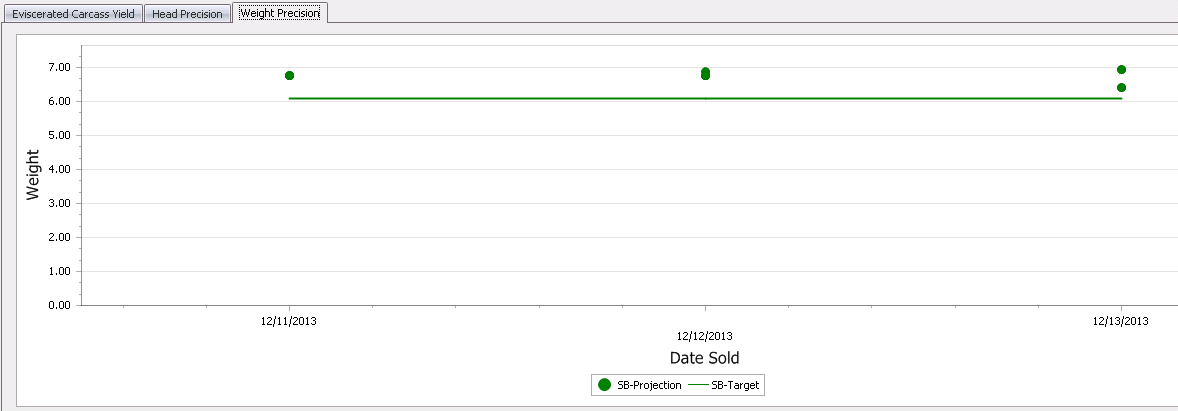
The Graph option charts the data from the BRPA Projected Schedules and
Eviscerated Carcass Yield Graph Data screens to allow the user to view
the projected weight for each kill, as compared to target and minimum
weights. Graphs can be viewed using the Eviscerated Carcass Yield tab,
Head Precision tab and Weight Precision tab. The graphs can be further
defined by filtering the BRA Projected Schedules grid as needed.
Eviscerated Carcass
Yield
Head Precision
Weight Precision


 to create
a new record.
 drop-down menu to add a new line and
select from one of the following options: `Default` or `Breeder`.
Selecting Breeder will allow the user to enter each individual field.
Select Default to view the Projected Entity List.

 button
and select 'Import Processing Transactions'.

 to calculate
the kill schedule.
 button.


