![]()
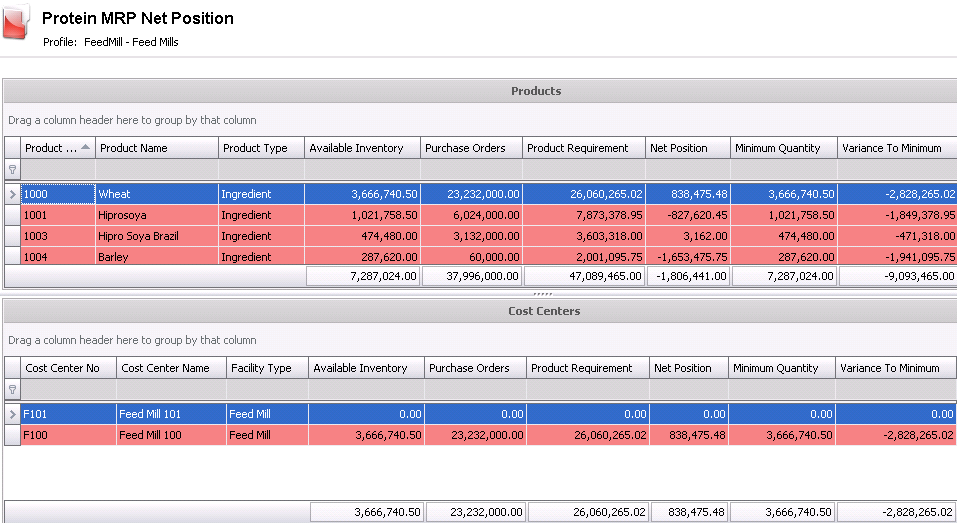
The Net Position shows a summary view of the net supply and demand position as compared to minimum inventory quantities. The Net Position is generated by profile and accumulates the data for the entire period of the profile. For example, if the report is from October to December, the data is accumulated for the three months and displays one record for the entire period.

The Products grid displays the global position for all cost centers by product.
Product No displays the product for the net position calculations.
Product Name defaults based on the Product No and describes the product.
Product Type indicates the type of product.
Available Inventory is the beginning inventory for the product for the profile period.
Purchase Orders represent the total of the purchase orders becoming available during the period.
Product Requirement indicates the total demand for the period.
Net Position is calculated as follows:
Net Position = Available Inventory + Purchase Orders -Product Requirement
Variance to Minimum = Net Position - Minimum Quantity
The Cost Centers grid displays the details for each cost center. The total of the Cost Centers grid equals the Product line.
Cost Center No indicates the cost center for the record.
Cost Center Name describes the cost center.
Facility Type indicates the type of cost center for the product.
Available Inventory is the beginning inventory for the product for the profile period.
Purchase Orders represent the total of the purchase orders becoming available during the period.
Product Requirement indicates the total demand for the period.
Net Position is calculated as follows:
Net Position = Available Inventory + Purchase Orders -Product Requirement
Variance to Minimum = Net Position - Minimum Quantity