![]()
The purpose of this document is to outline the basic steps to define the parameters and generate the BPA projections. The following sections are outlined in this document to assist the user in the required day-to-day tasks and represent the typical order of data entry and data generation.
This section will guide the user to set up all prerequisites needed to operate BPA. Setup will have been completed for BIM or HIM. This document will only focus on those same setup options required for BPA. The following components are outlined in this section:
Registry settings are used to determine projection methods. Each growout area must be defined.
In Admin>System>Registry>Poultry Registry>Growouts>PMTS Growout>BPA Growout, select General.
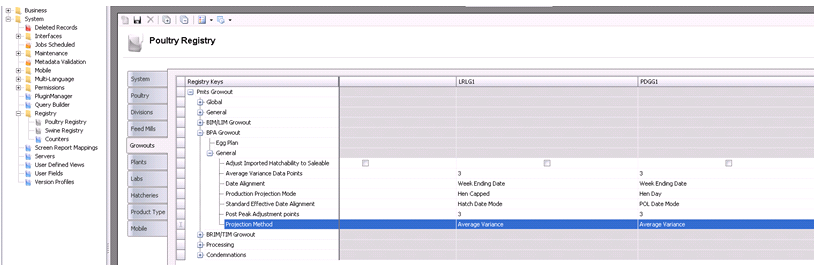
The following fields are required for BPA:
Adjust Imported Hatchability to Saleable –if selected, this indicates that flock data hatch statistics imported from BIM will be adjusted to % Saleability by multiplying actual hatchability by the standard for Weekly % Saleable Chicks (uses BIM Standards table).
Average Variance Data Points – enter the number of weeks BPA will use to calculate the average variance from standard when re-calculating projections.
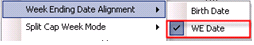
Date Alignment – select the option to use for Entity History:
Birth Date – aligns flocks statistics to the birth date.
Week Ending Date – aligns flock statistics to the week ending date.
Production Projection Mode – select an option to project hatching eggs:
Hen Day Mode – utilizes actual mortality (Entity History) or BPA Standard mortality % (Placements) to calculate weekly hen inventory available to product eggs. This option assumes percentages do no include mortality factors. (This option if based on actual hen inventory).
Hen Capped Mode – utilizes hen capitalized to calculate egg production. Assumes BPA Standard Production % include mortality factors. Used for Entity History and Placements. (This option uses the number of hens capped and BPA standards).
Standard Effective Date Alignment – Determines how standards will align to entities:
Hatch Date Mode – the BPA Standard effective date will align to the average hatch date of the flock.
POL Date Mode – the BPA Standard effective date will align to the date the flock started laying hatching eggs.
Post Peak Adjustment Points - enter the number of weeks BPA will use to calculate the average variance from standard when re-calculating projections after Peak production is achieved.
Projection Method – defines the projection method:
Average Variance – projection is based on the average percent difference from BPA Standards (recommended).
Regression Line – projection is based on the statistical relationship between actual performance and BPA Standards.
In BMTS>BIM>Master Data, select Farms.
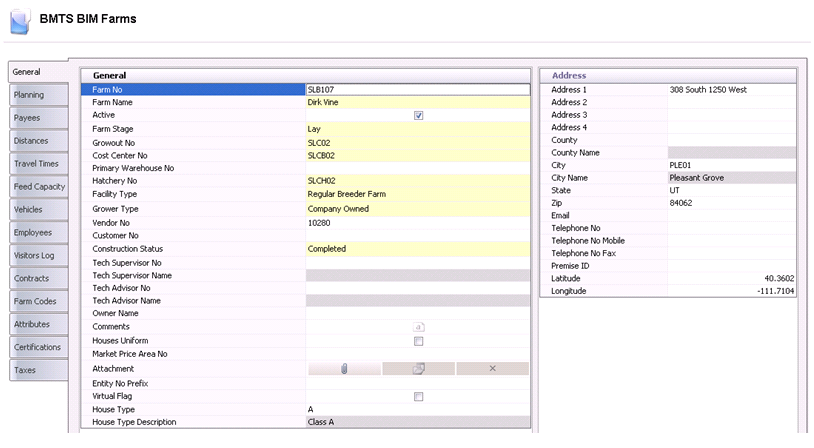
The following are required for BPA. The fields are located on the General tab.
Farm No – unique identifier assigned by the customer to use as a code for the unit.
Farm Name – alphanumeric character code to enter a name for the unit. This field will be displayed throughout the system and on delivery documents and other documents related to the unit.
Active – indicates whether the unit is active or inactive. Default is set to active.
Farm Stage – assigns the unit to the grow stage. Options for BIM are Brood, Lay,Grow or Mixed.
Growout No – the farm area groups units together that are used for reporting purposes. Farm No is a required field that is customer defined and must be created prior to creating the units.
Hatchery No – identifies the primary hatchery associated with the unit.
Virtual Flag – used in planning to identify when more houses are needed. Should only be selected if the farm is a virtual farm.
The houses should be configured to determine head capacity and placement cycles. There are two tabs that need to be reviewed for BPA.
In BMTS>BIM>Master Data, select Houses.
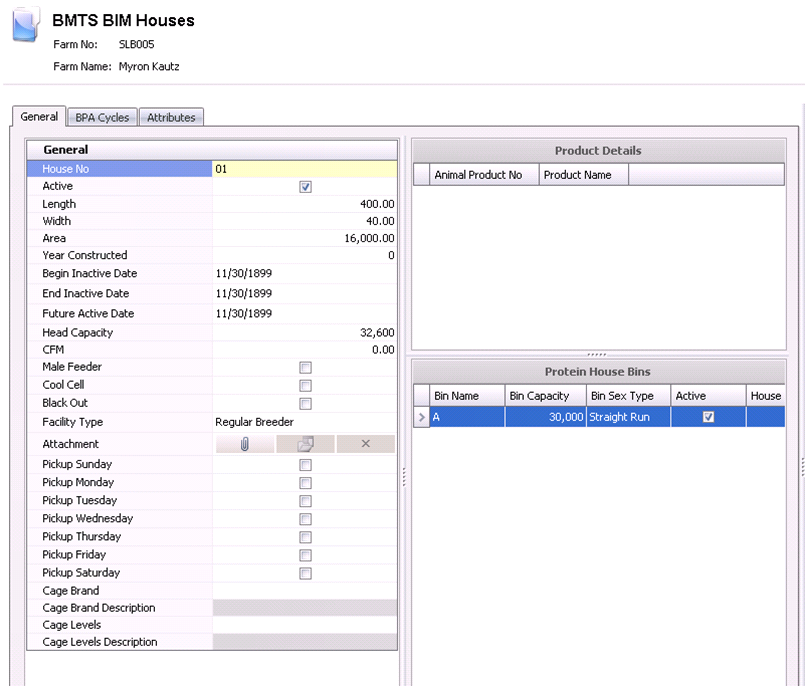
The following fields are required for BPA in the General tab:
House No – defines the house number
Active – if selected, this indicates the house is active. An unchecked house is inactive.
Area – enter the square foot of the house (Length x Width).
Begin Inactive Date and End Inactive Date – used to signal BPA if/when the house will be unavailable for planning placements.
Future Active Date – used to signal BPA when a new house will be available for planning placements.
Head Capacity – enter the number of total birds (males and females) house will hold.
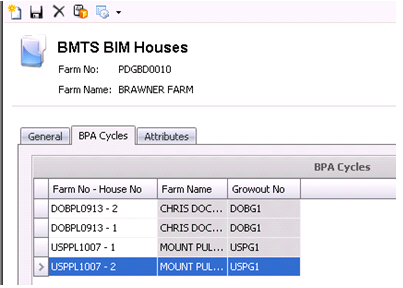
The BPA Cycle tab is used to link brood farm to the lay farm or in multi-stage operations link brood to grow farms and grow to lay farms. *Note: The BPA Cycles tab will only need to be set up if the system will be used to generate the placement plan.
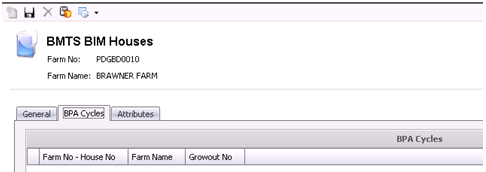
Steps to map brood house to lay house.
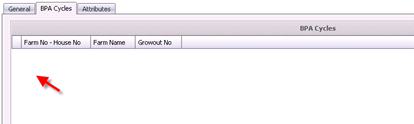
Select
the New button or the F4 button.
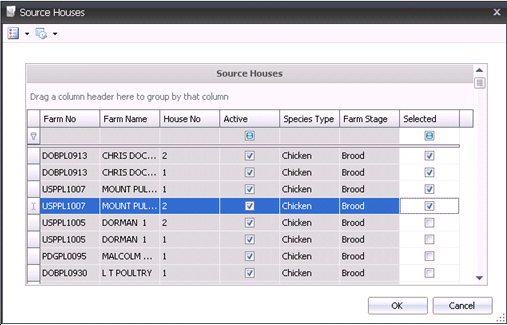
A listing of brood houses will appear. Select all brood houses that will source the lay house.

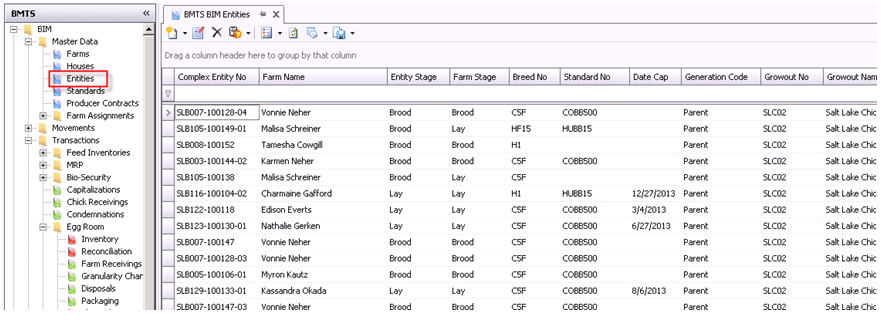
The BIM entities must have a breed code defined to be associated to projections in the BPA.
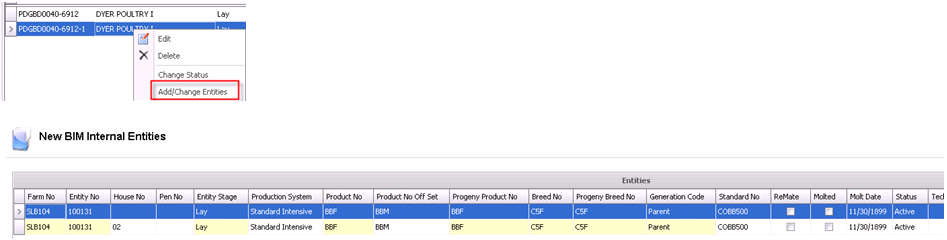
In BMTS>BIM>Master Data, select Entities.
Edit the Entity by highlighting the entity, right-clicking and selecting Add/Change Entities.
The following fields are required for BPA:
Farm No – defines farm where the entity resides. This will be the first segment of the Entity No.
Entity No – enter the code that identifies the entity. This code will represent the second segment of the Entity No.
House – if the granularity is defined at the house level, a house can be assigned to the entity from a predefined list of houses for the farm. The house can only be assigned after the top level entity is created. This code will represent the third segment of the Complex Entity No.
Pen – if the granularity is defined at the pen level, a pen can be assigned to the entity. The pen can only be assigned after the top level entity is created. This code will represent the fourth segment of the Complex Entity No.
Entity Stage – represents the stage of the entity when it is being added to the system. The stage will default based on the stage of the selected farm. Available options are: Brood/Lay, or for a multiple stage operation, Brood/Grow/Lay.
Product No – required field that defines the product that is assigned to the entity.
Product No Offset – used for planning purposes in determining the offset product that will be produced from the placement.
Breed No – required for BPA, used in Planning to determine the breed that will be produced from the placement.
Generation Code – indicates the generation of the entity. Available options are: GGP, GGP, GP, Pedigree, Parent or Layer.
ReMate – identifies the new entity that results from a molted entity.
Molted – indicates if the entity has been molted.
Molt Date – if the entity is molted, the field indicates the date that the entity was moved to the molting process.
Status – indicates if the entity is active or inactive.
POL Date – indicates the date that the entity started to lay.
BPA Exclude Profile Flag – if the BPA option is being used, select this field if the entity is to be excluded from projections.
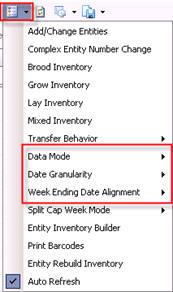
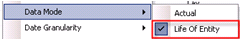
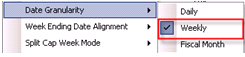
In the BIM Entity index screen, select Options
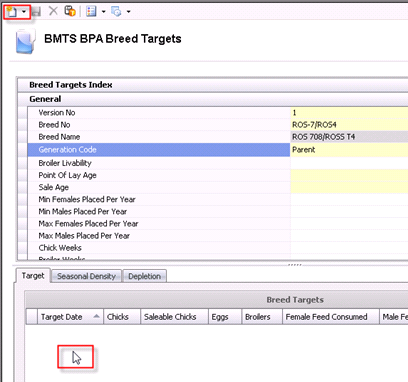
Master Data node is the basis for BPA Projections. The data is set up to define how the projections will be forecasted. Once Master Data is set up, the only time you would need to come here would be to add new Targets or Standards. There are two required areas for Master Data:
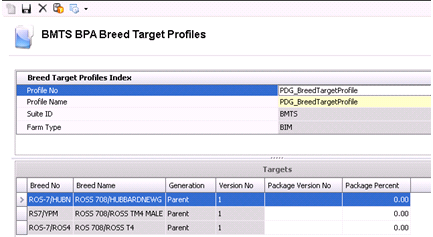
Breed targets are established by progeny breed. The progeny breed is the offspring of the flocks placed on the ground. The targets will be the basis to determine required placements to meet the established targets. For most companies the Breed and Progeny Breed will be set up to be the same.
There are four components in the Breed Targets section:
or the F4 button.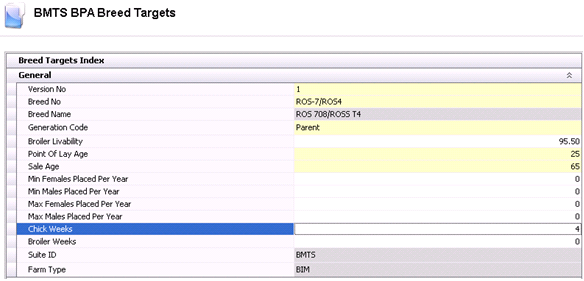
The following fields are required for BPA in the General tab:
Version No – field to identify the version of the breed target that will be used in projections (alphanumeric, max 20 characters).
Breed No – selected from existing breed codes to define the breed that will be used in the projection.
Generation Code – selects the generation required for the projection.
Broiler Livability – calculates the number of broilers expected from hatch egg production.
Point of Lay Age – used to identify the first week of egg production. Will be used in placements to auto-populate the POL date. *Note: must be the same age as in the Standard versions.
Sale Age – defines the target sell age of the lay entity. There are also options to define the target selling age in the entity or the placement schedule. This value will default if not entered in other options. Will be used in placements to auto populate Sale Date and sale age.
Chick Weeks – the number of weeks between egg production and chick production. For chicken, the value is usually 3 weeks unless a company keeps a week of eggs in inventory and wants to offset chicks by 4 weeks.
Broiler Weeks – the default number of weeks between chick production and processing.
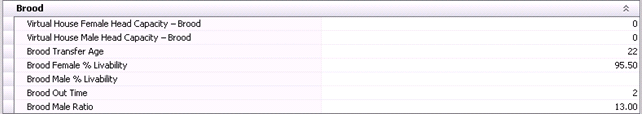
The following fields are required for BPA in the Brood tab:
Virtual House Female and Male Head Capacity - Brood – default capacity for females when virtual farms are created. Used for planning placement (optional field).
Brood Transfer Age – default age that the entity is transferred from brood to lay; or in a multi-stage operation, the default age that the entity is transferred from brood to grow. Used in Placements to auto-populate transfer date and age.
Brood % Livability – represents the number of birds that are expected to be transferred from brood to lay or brood to grow.
Brood Out Time – the number of weeks between brood placements (clean-out).
Brood Male Ratio – the percentage of males placed as compared to females.
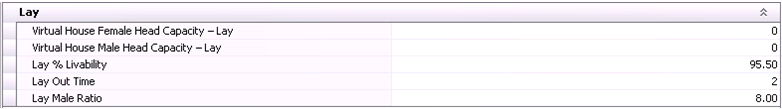
The following fields are required for BPA in the Lay tab:
Virtual House Female and Male Head Capacity - Lay – default capacity for females when virtual farms are created. Used for planning placement (optional field).
Lay % Livability – optional default percentage of birds that will be available for processing at the end of the lay cycle or the quantity that will be available to transfer to molt.
Lay Out Time – the number of weeks between lay placements (clean-out).
Lay Male Ratio – the percentage of males placed as compared to females.
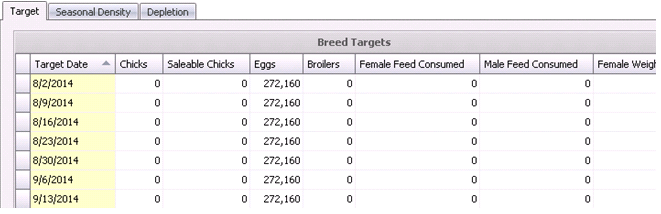
The Target tab is optional. This tab is used for planning placements and also used as a curve in the Entity Performance graph. Data is entered weekly as Chicks, Saleable Chicks Eggs and or Broilers.
button visible.
button
or selecting F4.
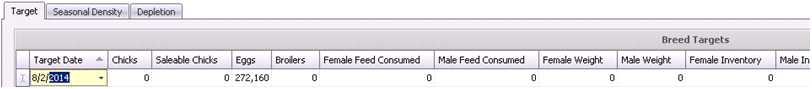
In order to use the Range Option, at least one week of data is required to be entered. The Range function works by copying down that line of data. Data can be manually changed as needed.
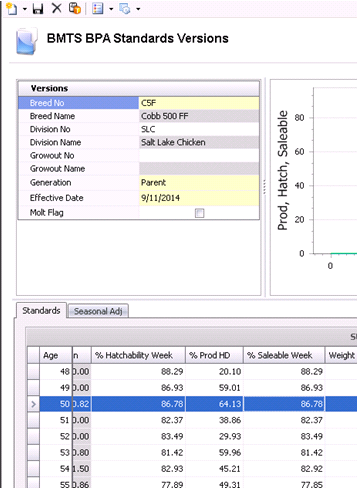
The user must create a BPA standard for every breed that is to be projected. The BPA Standards are independent from the BIM Standards. The standards are created by breed, generation and effective date for the entity on the farm. The effective date is based on the placement date of the entity. There is also an option to assign the standard to a Division and or Growout so that the standard only applies to facilities within the defined Division and or Growout. The standard must begin at week 0. Standard Versions can be created manually or can be system generated.
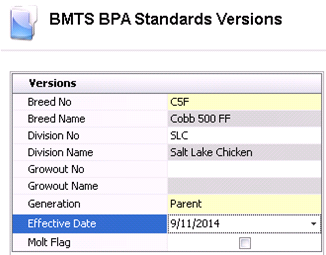
There are three sections in the manual standard version:
button and a blank Standard
Version screen will appear.
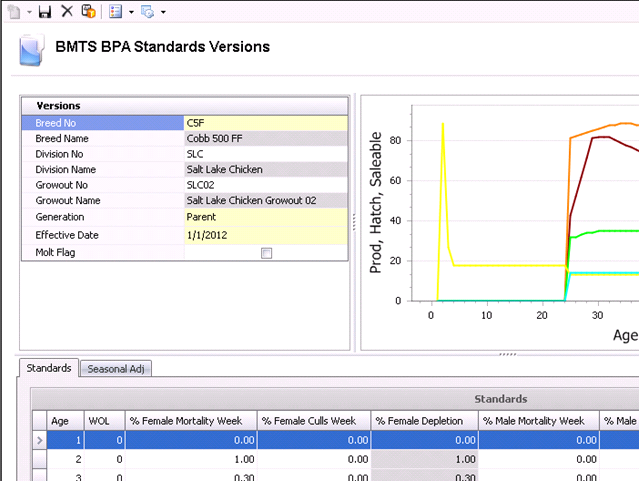
Breed Name – will auto populated from the Breed No selected.
Division No – optional field used to apply the standard to all farms within a specific division.
Division Name – will auto populated from the Division No that is selected.
Growout No – optional field used to apply the standard to all farms within a specific growout. If the Growout No is not populated, the standard will apply to all farms.
Growout Name – will default based on the selected Growout No.
Select the Generation of the breed.
Enter the Effective Date that standards will begin being used for projections.
Check the Molt Flag if the breed is for a molted flock.
The Standards are entered by week of age for items that require projections.
button.
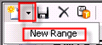
Ages can be entered one at a time or by using a range. To enter a
standard by an age range, click the drop-down menu on the button
and select 'New Range'.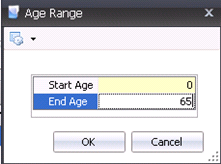
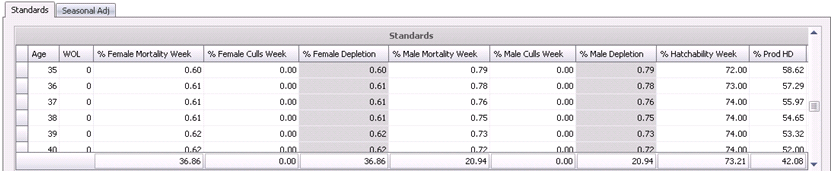
The fields most often used for projections are:
Age – created when the new line or range is created.
WOL – derived from Breed Targets Point of Lay.
% Female Mortality Week – the projected percentage of female mortality for each week.
% Female Cull Week – the projected percentage of female culls for each week.
% Female Depletion – a calculated field totaling the female mortality and culls.
% Hatchability Week – the projected hatch percentage for each week.
% Prod HD – the projected percentage of hatching egg production for each week.
% Saleable Week – the projected percentage of saleable chicks for each week.
*Note: The age that % Prod HD starts must be the same as the Breed Target for each breed. If Breed Target has 25 as the POL age the production must begin on week 25 of the standards.
Menu Options allows several ways of importing or exporting standards rather than manually entering each line. Available options are:
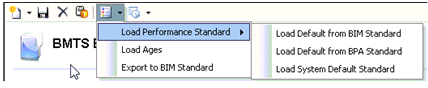
The Load Performance Standard has three options:
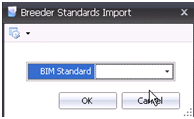
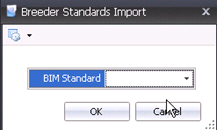
Load Default from BIM will import the standards from
BIM. Select the BIM standard that matches the Breed No.
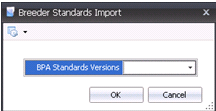
Load Default from
BPA
will import the
standards from BPA. Select the BPA standard that matches the Breed
No.
Load System Default Standard will
import a system standard. There is no option to choose a standard
as there is only one.
* Note: Importing
standards will erase current standards.
Load Ages will only create the age for the standards. All other information will need to be manually entered.
Exporting to BIM will export the BPA Standard to BIM Standards. From the BIM Standards list, select the BIM standards to be replaced.
The first step in the process is to create an Entity profile that contains only the breeds of the desired standard. See: Entity Profile. *Note: putting the breed and the word “Std” (Standard) in the profile name will help to better identify the profile that is being used.
After the Entity profile has been created, go to Planning>Entity History.
Filter for the correct Profile and `Import All Data.`
After the import, go to the BPA>Master Data>Standard Versions.
Create a new standard version by entering data only in the Versions grid.
Save and close the record.
In the Standard Version index screen, highlight the newly created breed and select `Calculate.`
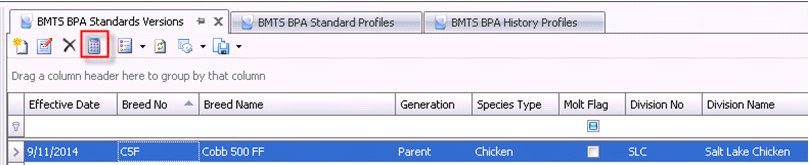
When the Projections pop up appears, select the entity profile created for this breed.
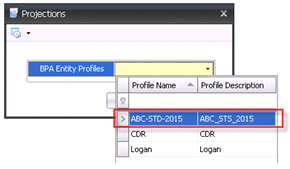
Click the `OK` button and when the warning screen appears, click `OK` again.
The Standards will then be calculated.
Profiles are created so the user will have the ability to create different scenarios. Examples of a scenario could be to project based on growout area, generation, breed, etc. Once all of the profiles have been created, the projection profile must be created to link all of the profiles together.
The Profiles Node is divided into the following sections:
The Placements and Projections profiles will be used to link the previous profiles together in order to create the different scenarios.
Target Breed Profiles are groups of breeds that will be projected. The profile will look to the target version for the breeds and the corresponding entities and placements to project the volumes. An example of a target profile is by growout area, and only breeds that are in the specified growout are required.
button to create
a new target profile.
to
create a new target.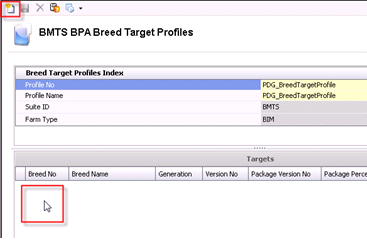
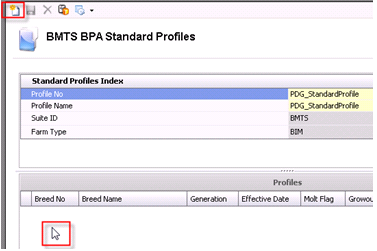
Standards Profiles assign the standard version to the projection for placements and entities. An example of a profile is by growout area, and only standards for breeds in the specified growout area should be included.
button to create a new standard profile.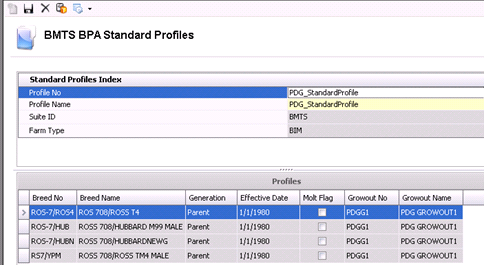
In the Profile No field, enter a unique number to identify the profile being created.
Enter a Profile Name to describe the profile.
Set
the focus in the Profiles section and click the button.
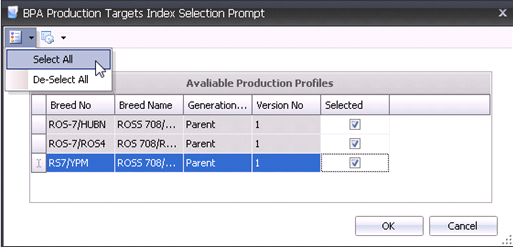
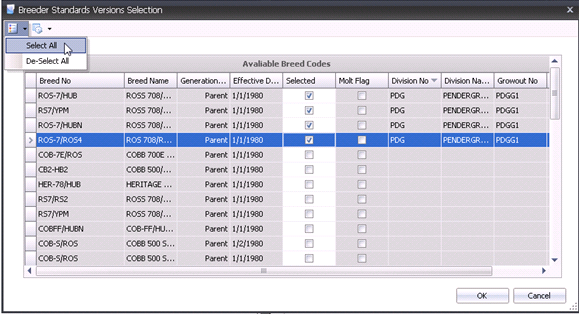
In
the Breeder Standards Versions Selection dialog box, click on the Selected box
for all breeds required for the standard profile. Click 'OK' and the
information will be added to the Profile section.
The Farm Profiles assign the farms to the profile that will be projected. A farm profile must be created for each stage that is used – Brood and Lay. The farms can be added individually or filtered and added in groups of farms. Multiple profiles can be created for the different scenarios. An example of a profile is by growout area . For this profile, only farms in the specified growout area would be included.
button.
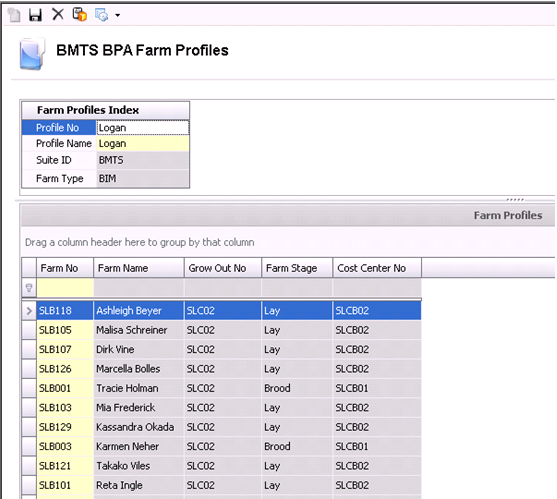
Enter a Profile No to identify the profile being created.
Enter a Profile Name to describe the profile.
Left-click in the Farm Profiles
section to activate and select the button.
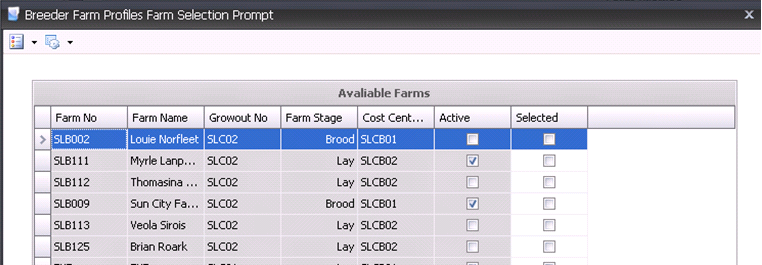
In the Breeder Farm Profiles Farm Selection Prompt, click on the Selected box for all that apply to the profile being created. Click 'OK' and the information will be added to the Farm Profiles section.
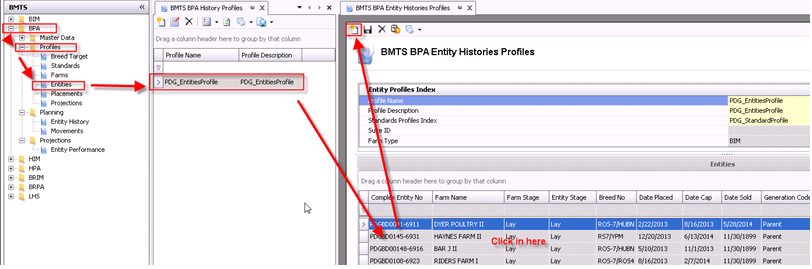
Entities must be created and set up in BIM prior to being selected. Once the profile is create it will be used in Planning>Entity History. For this reason, there will be weekly, bi-weekly or monthly maintenance on the projection profile - adding and deleting entities. The maintenance schedule will depend upon how often projections are ran. Multiple profiles can be created for different scenarios. An example of an entity profile is by growout area, and only entities from the specified growout would be included. *Note: If projecting for eggs, only lay flocks at the H or F GRN should be selected, not both.
In the History Profiles main index, click the
button.
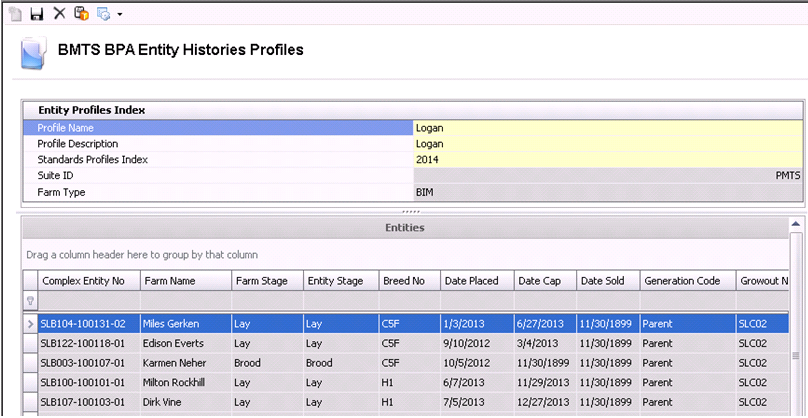
Enter a Profile No to identify the profile being created.
Enter a Profile Name to describe the profile.
Select the Standards Profiles Index from the list. This list is from the Standard profile created earlier.
Left-click in the Entities section
to activate the New button and then click the button.
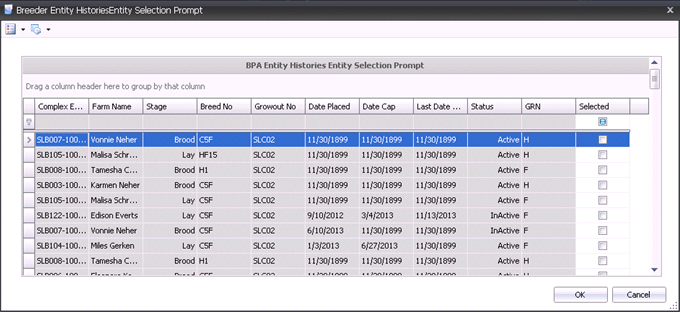
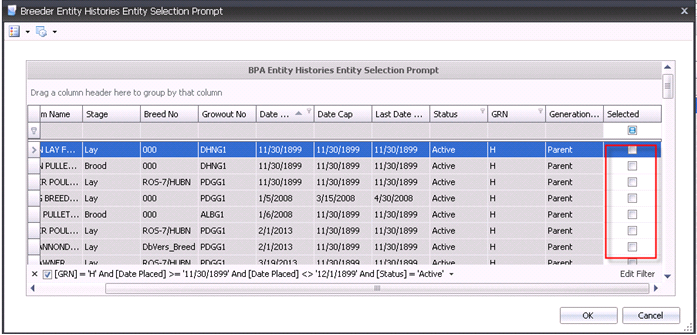
In the Entities History Entity Selection Prompt, click on the Selected box for all that apply to the profile being created. (If selecting for a specific growout area filters can be applied to restrict the amount of data you see. Recommended filters are:
GRN = H
Status = Active
Date placed does not equal 11/30/1899
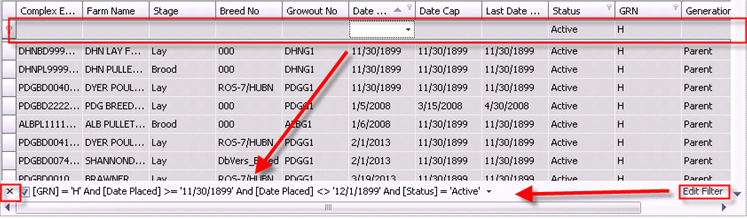
To remove the filter, click on the X.
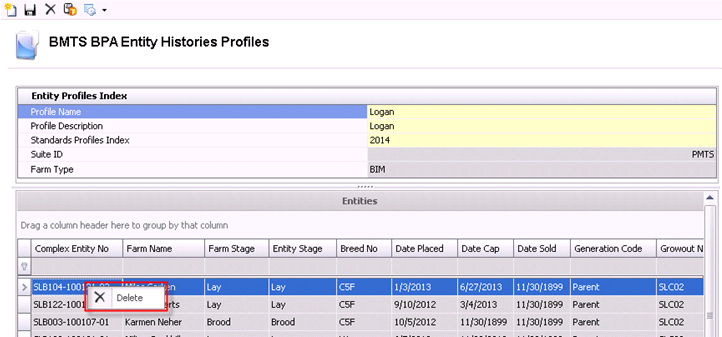
Click 'OK' and the information will be added to the Entities section. All data fields will be populated based upon the entity selections. The data is derived from Entities in BIM.
*Note:
For projection purposes, all inactive and closed flocks should be removed
from the profile. This can
be done by highlighting the entity and selecting ![]() in the menu, or by right-clicking and selecting `Delete`. Having unnecessary flocks in the
profile will slow the projection process down.
in the menu, or by right-clicking and selecting `Delete`. Having unnecessary flocks in the
profile will slow the projection process down.
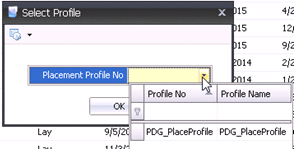
The Placement Schedule Profile links the standards and the targets to the placement schedule.
button.
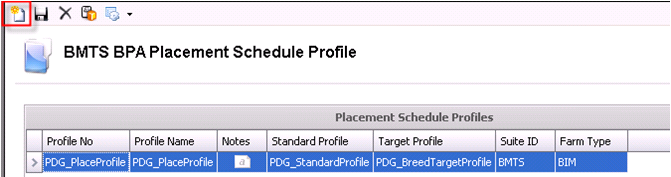
Enter a Profile No to identify the profile being created.
Enter a Profile Name to describe the profile.
Notes is an optional text field to enter information regarding the profile.
Select the Standards Profile from the list. The standard profile is created in the Profiles section of Standards.
Select a Target Profile from the list. Target profiles are created in the Profiles section of Breed Targets.
Projection Profiles are master profiles that link all of the profiles together to provide the base for the projection. The Target Unit needs to be defined based on Eggs, Chicks or Broilers.
button.
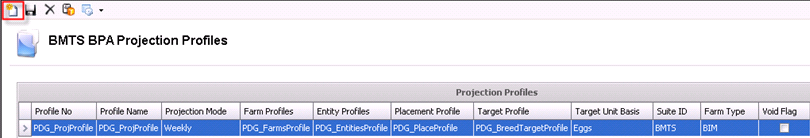
Enter a Profile No to identify the profile being created.
Enter a Profile Name to describe the profile.
Select the Projection Mode to determine if projections are created for each day or for each week. Available options are Daily or Weekly.
Select the Farm Profile from the list.
Select the Entity Profile from the list.
Select the Placement Profile from the list.
Select the Target Profile from the list.
Select the Target Unit Bases. Available options are Chicks or Eggs. Projections will be projected based on egg, chick or broilers.
Select the Void Flag to cancel the profile. This is not recommended. Voiding the profile means that the profile cannot be deleted. Voiding the profile lock the profile and you will not be able to editor delete the profile if needed.
The Planning node consists of historical and future entity data. The historical and future entities are used for projection purposes. Entity History contains all active flocks and the historical data that pertains to each entity. Projections for Entity History are based upon the actual performance of the entity. Movements contain the "placement schedule” or future entity placements. Projections for Movements are based on standards set up in Standard Versions.
The Planning Screen is divided into the following sections:
Entity History displays historical data for entities that are currently in production. There are also options within the Entity History to adjust the factors so that the entity can be projected more accurately for future production. The history can be imported regularly to increase the accuracy of the projections.
There is no option to create a new entity or add an entity to this screen. An entity must be added in an Entities Profile before it is displayed in entity history.
In Entity History index screen, double-click on the entity that requires editing, or highlight the entity and select Edit from the menu. There are four sections in the Entity History section:
The data is derived from BIM>Entities. The following fields are required for accurate projections:
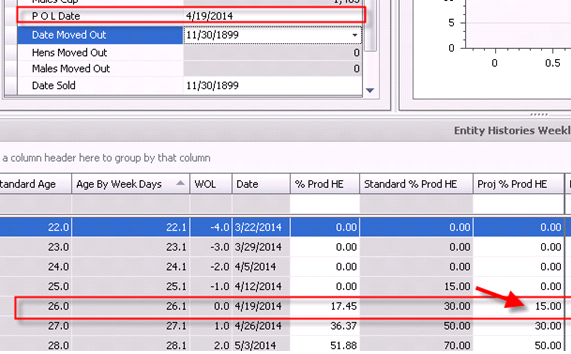
POL Date (Point of Lay) - must be entered if the flock begins production before or after 25 week. (Week 25 is the example in the document for Targets and Standards). The POL Date will re-align the projection to match production (Registry setting Standard Effective Date is set to POL Date). Below is an example of an entity without the POL date entered:
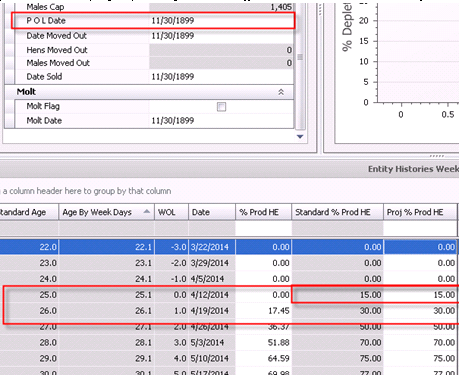
Below is an example with the POL Date entered. The POL Date re-aligns projections to match production.
Date Sold should be entered if the flock is going to be sold before or after the target sale age defined in Targets.
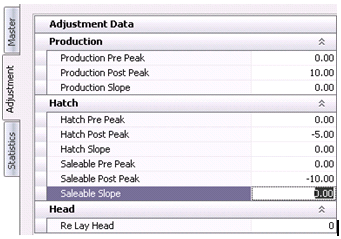
The
Adjustment tab contains factors that update or adjust the performance
factors. After adjustments are entered, the entity will need to be calculated.
Calculation is done by using the  button in the menu.
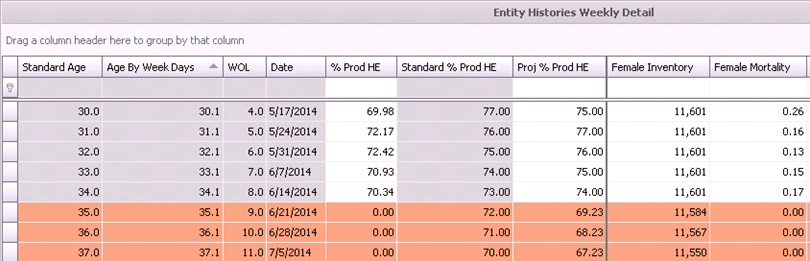
After adjustments/updates are made to the entity, it must be saved, imported and calculated to get the latest projections. Data must be imported using the import options. The import will update the projected data with actual data from BIM. After the new data has been imported then the flock must be calculated using the button. Calculating after each import will re-project the entity using the latest data statistics. Projected data lines will be highlighted orange.
There are two components in the Entity History Weekly Detail section:
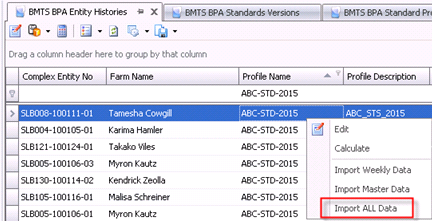
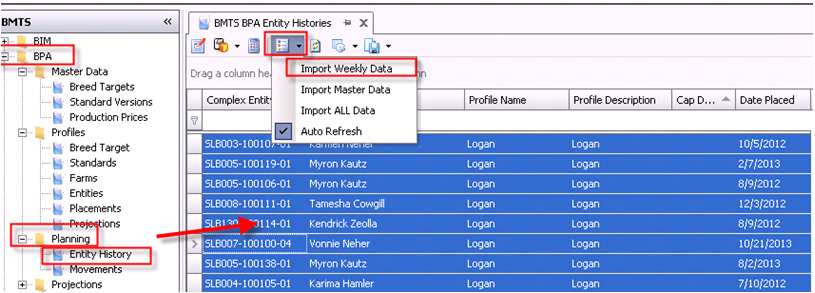
In the Entity History Index screen, options are available for importing BIM Data. Importing updates the Entity History with the most recent BIM Data. In order to get accurate projections, imports should be done on a regular basis.
Click
on the 
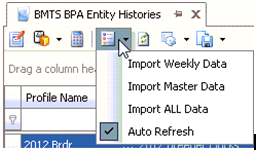
Import Weekly Data will import only the weekly transaction data pertaining to the entity. This option should be used if adjustments have been made to the flock.
Import Master Data will import only the header information pertaining to the entity. This option should be used if the BIM Master Data has changed.
Import All Data will import all data, weekly transactions and header data. This option should be used for a new entity; the first import.
Auto
Refresh when checked will automatically update the index
screen. If it is not selected, the refresh will have to be done manually
by clicking on the  button.
*Note: While in the Index screen, the entities that will be imported must be highlighted prior to importing. Entities can be imported individually or all at the same time. To select all entities, use the Ctrl + A keys to highlight all the entities and then select the import option needed. To import an individual entity just click on the entity to be imported and select the import option needed.
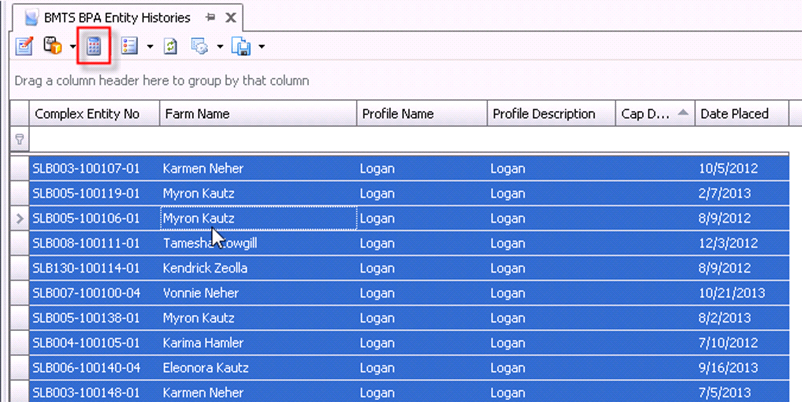
After
the new data has been imported the entities must be calculated using
the
button. Calculating after each import will re-project the entity
using the latest data. Projected data lines will be highlighted orange
as a quick reference displaying that the lines are projected. The
data includes statistical and cost information.
Movements, or the "Placement Plan", can be manually entered or system-generated. The placement plan will also be used in Projections to generate long range forecasts. Prior to creating placement plans, a Placement profile must be created. See: Profile Placements.
*Note: If the system is not being used to plan placements or forecast brood flocks, only the lay flocks need to be entered. If the system is used to plan placements or forecast brood flocks, the brood placements must be entered.
button.
button to add new lines. The required fields are highlighted in yellow.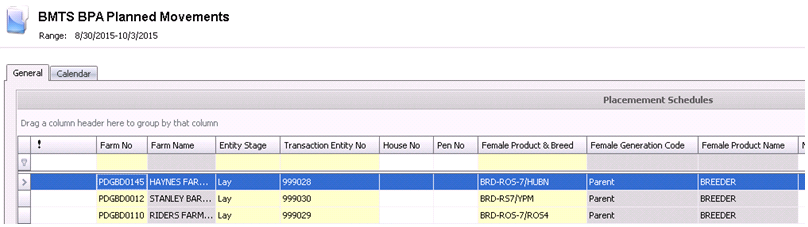
Farm No – select the farm being used for the placement.
Farm Name – will populate based on the selected Farm No.
Transaction Entity No – identifies the BIM/BRIM entity. This can be entered manually or generated by the system. The Registry must be configured for system-generated entity numbers.
House No – select the house in which the entity is being placed. (Optional if system is not planning placements).
Pen No – optional field to indicate the pen in which the entity will be placed.
Female Product & Breed – identifies the product number and breed code of the females.
Male Product & Breed – identifies the product number and breed code of the males.
Progeny Product & Breed – will default to be the same product as Female Product & Breed
Females – that will be placed in the farm/house.
Males – that will be placed in the farm/house.
Date Placed/Hatched – for the planned placement date.
Date Cap – displays the date that the entity will be capitalized. This field is system generated from Breed Targets.
POL Date – displays the date that the entity will start to lay. This field is system generated based on Breed Targets, and can be overwritten if needed.
Date Moved In – displays the date that the entity was moved into the farm and entity stage. The system will generate this date based on Breed Targets, and it can be overwritten as needed.
Date Moved Out – displays the date that the entity was moved out of the farm and entity stage. This field is System generated from Breed Targets and can be overwritten as needed.
Date Sold – displays the date that the entity was sold at the processing plant. This field is system generated from Breed Targets and can be overwritten as needed.
Source Complex Entity No – Only used for lay entities (the brood entity supplying the lay entity). Will display the brood farms that were hatched/placed on the same date as the lay entity. If not entering brood entities in placements, Source Complex Entity No is not required.
Before the system can plan placements, there has to be one full cycle of house utilization (placements). There are two options in planning placements and they are found in the menu on the Movements index screen:
Plan Placements to Fill Capacity was designed to fill the houses as they became available. The planning is not done based on targets, but rather on how many egg/chicks can be produced from the available housing.
In the BPA
Movements main index, click the Options  button
and select 'Plan Placements to Full Capacity'.
button
and select 'Plan Placements to Full Capacity'.
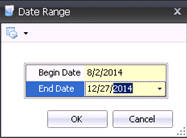
The Plan Placements to Full Capacity dialog box will appear.
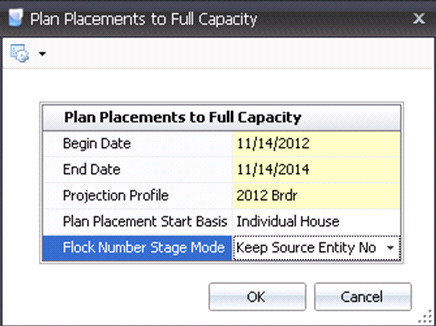
In the Begin Date field, enter the date that production is needed. Flocks will be placed based upon peak production of the entities to meet the targeted projection.
In the End Date field, enter the date production is no longer needed.
Select the Projection Profile (created in Projections Profiles).
Select the Plan Placement Start Basis to plan the housing schedule. If all the houses on the farms are to be filled before going to the next farm, select the 'Entire Farm' option. If houses are filled according to the first available, select the ' Individual House' option.
Select the Flock Number Stage Mode to indicate how the entities will be identified at each stage. There are two options:
Create a New Entity - will give the entity a new Entity No at each stage.
Keep Source Entity - will keep the same Entity No for the life of the entity.
Click 'OK' and the placement schedule will be created.
Plan Placements to Breed Targets was designed to fill the houses as they are needed to meet demand or targets. When demand/targets are greater than available housing, the system creates Virtual Houses and continues placing houses until targets are meet. To use virtual housing, one farm must be created and the virtual flag must be selected.
In
the BPA Movements main index, click the Options button and select
'Plan Placements to Breed Targets'.
The Plan Placements to Breed Targets dialog box will appear.
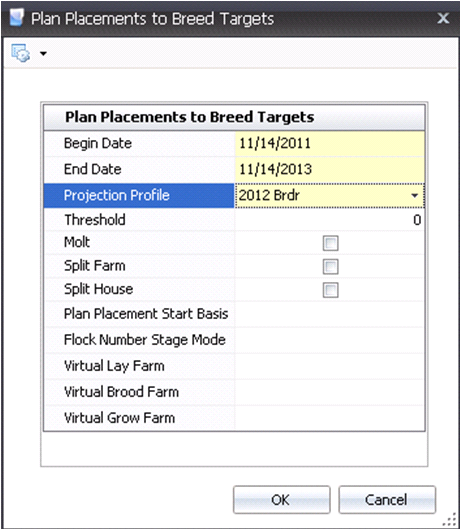
In the Begin Date field, enter the date that production is needed. Flocks will be placed based upon peak production of the entities to meet the targeted projection.
In the End Date field, enter the date production is no longer needed.
Select the Projection Profile (created in Projections Profiles).
Enter the Threshold as a percent allowance for the projections to project over/under the target line.
If the Molt flag is selected, the system will plan to automatically molt flocks. If the flag is not selected, the system will not plan to molt flocks.
If the Split Farm flag is selected, the system will allow the farm to receive chicks on multiple dates.
If the Split House flag is selected, the system will allow the house to receive chicks on multiple dates.
Select the Plan Placement Start Basis to plan the housing schedule. If all the houses on the farms are to be filled before going to the next farm, select the 'Entire Farm' option. If houses are filled according to the first available, select the ' Individual House' option.
Select the Flock Number Stage Mode to indicate how the entities will be identified at each stage. There are two options:
Create a New Entity - will give the entity a new Entity No at each stage.
Keep Source Entity - will keep the same Entity No for the life of the entity.
Select the Virtual Lay Farm. If Targets project more birds than there are houses, the Virtual Farm will allow the system to keep placing birds into virtual houses until the target is met. Virtual Farms must be set up in BIM.
Select the Virtual Brood Farm. If Targets project more birds than there are houses, the Virtual Farm will allow the system to keep placing birds into virtual houses until the target is met. Virtual Farms must be set up in BIM.
Select the Virtual Grow Farm. If Targets project more birds than there are houses, the Virtual Farm will allow the system to keep placing birds into virtual houses until the target is met. Virtual Farms must be set up in BIM.
Click 'OK' and the placement schedule will be created.
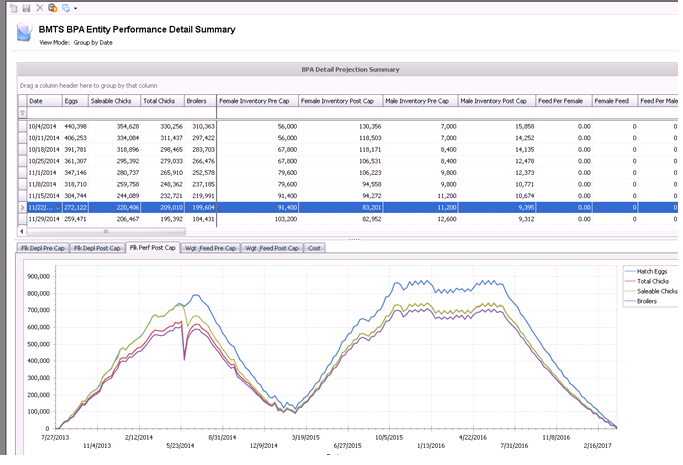
The Projections main index screen contains all the projection profiles created in Projections, in the Profiles node. There are multiple views available after the selected profile is generated. Before projections are calculated, verify that any new entities in entity history are the same as the entities in placement schedule. Complex Entity No, Breed, and Date Placed/Hatch should be the same.
button, or right-lick the profile and select `Calculate` from the
menu.
In BPA>Profiles>Entities
button.
In BPA>Planning>Entity History:
Review the flocks for accuracy (adjustments can be made in the adjustments tab as needed).
Add the POL Date to flocks that do not come in at 25 weeks.
Highlight all flocks and select Calculate.
In BPA>Planning>Movements:
Verify that the Complex Entity No, Date Place and Breed match the flock that was imported into Entity History.
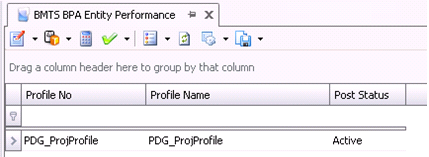
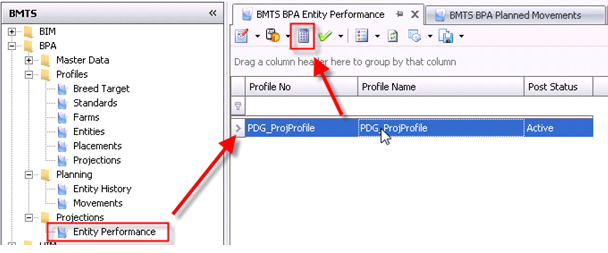
In BPA>Projections>Entity Performance:
a. Highlight the profile and select Calculate.
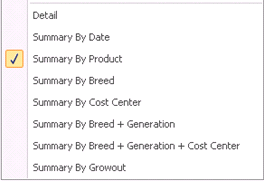
To view results, right-click the profile and select an option.
The system has many pre-defined system reports to provide immediate reporting capabilities. Custom reports can also be created if the system reports do not meet the requirements. *Note:Custom reports will not be covered in this document as the average BPA user will not be creating reports.
System reports can be found in the menu of each screen. To view Projection reports:
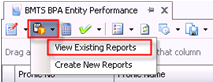
Select the report icon and then click View Existing Reports.
A list of all available projection reports will appear.
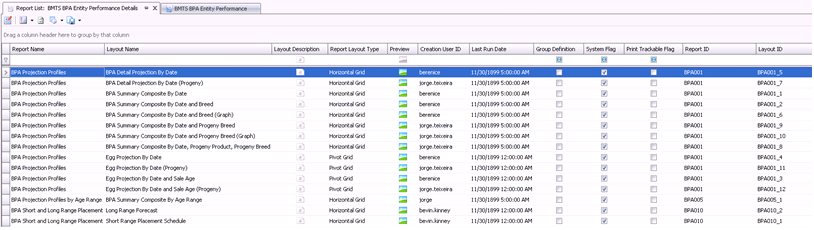
Highlight the required report
and double-click on the report or select the Edit  button.
Enter the prompts required to generate the report. All prompts are not required to be entered. The prompts will filter or restrict the data based on the selected prompts. *Note: Not entering prompts will cause the report to gather all the data in the system and take a long time to generate. To many prompts will restrict the data you see.
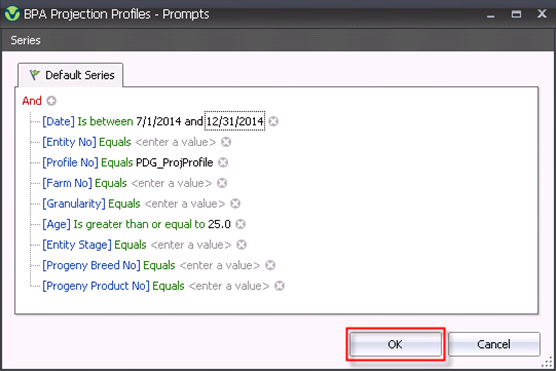
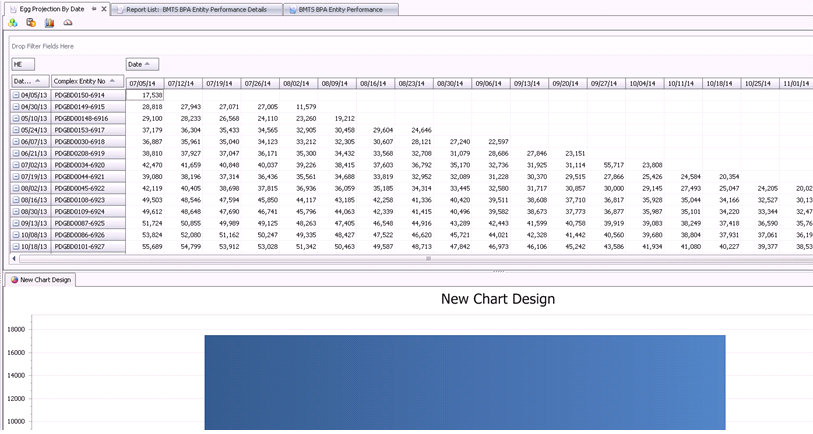
After prompts are entered, click the OK button and the report will appear. *Note: If you do not want to see the chart, select F7 and the graph will disappear.
``