entity history

The Entity History displays historical data for entities that are currently
in production. There are also options within the Entity History to adjust
the factors so that the entity can be projected more accurately for future
production. The history can be imported regularly to increase the accuracy
of the projections.
An entity must be added in an Entities
Profile before it is displayed in entity history.
The following details are outlined in this section of the document.
Create an Entity History
Inside of Entity History are several tabs that pertain to the history
and projections of each entity.
Master Data
The Master Data tab is a read only screen. The data is derived
from BIM>Entities.
Master
The Master section contains three sub-sections:
- In BMTS>BPA>Planning,
select Entity History.
- In the Entity Histories main index, click
on the entity to be viewed and select the Edit
 button. Alternatively, double-click on the required entity.
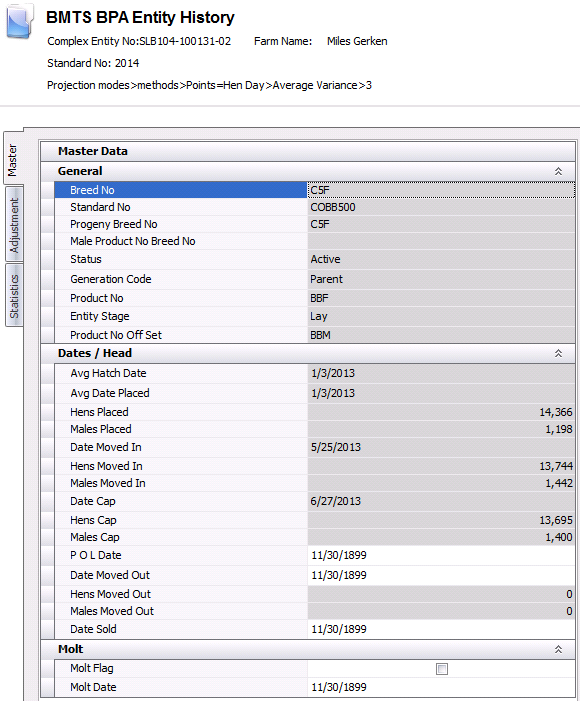
General
- Click on the General
tab.
- Breed No
indicates the breed code for the entity.
- Standard No
is the BIM standard that has been assigned to the entity.
- Progeny Breed
No identifies the parent breed.
- Status
indicates if entity is active or inactive.
- Generation Code
represents the generation of the entity. Generation will be displayed
as: GGGP, GGP, GP, Pedigree, Parent or Layer.
- Product No
indicates the product that was assigned to the entity at placement.
- Entity Stage
displays the entity stage. The entity stage will be: Brood, Grow or
Lay.
- Product No Off
Set is transferred from the entity master and used in HPA for
planning purposes.
Dates/Head
- Avg Hatch Date
displays the average hatch date of the birds placed.
- Avg Date Placed
displays the average placement date of entity.
- Hens Placed
displays the number of females placed for the entity.
- Males Placed
displays the number of males placed for the entity.
- Date Moved In
displays the date that the birds were moved from brood to lay.
- Hens Moved In
displays the number of hens moved from brood to lay.
- Males Moved In
displays the number of males moved from brood to lay.
- Date Cap
is the date that the entity is capitalized.
- Hens Cap
displays the number of females capitalized.
- Males Cap
displays the number of males capitalized.
- POL Date
is the date that the entity starts to lay. This date can be manually
entered/changed as needed.
- Date Moved Out
is date that the entity is moved out from the lay farm. This date
can be manually entered/changed as needed.
- Hens Moved Out
displays the number of females moved from the lay farm.
- Males Moved Out
displays the number of males moved from the lay farm.
- Date Sold
displays date that the entity was sold. This date can be manually
entered/changed as needed.
Molt
- The Molt
Flag will be selected if the entity has been molted.
- Molt Date
represents the date that the entity was transferred to molt.
Adjustment
The Adjustment tab contains factors that update or adjust the performance
factors. After adjustments are entered, the entity will need to be calculated.
Calculation is done by using the button
in the menu.
button
in the menu.
The Adjustment section contains three sub-sections:
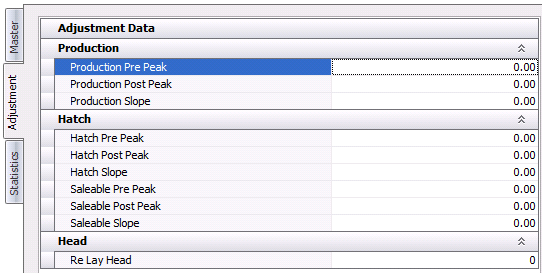
Production
- Production Pre
Peak represents the adjustment for percentage production that
is required prior to peak production. The factor is entered as a percentage.
The screen must be calculated for the data to be adjusted.
- Production Post
Peak represents the adjustment for percentage production that
is required after peak production. The factor is entered as a percentage.
The screen must be calculated for the data to be adjusted.
- In the Production
Slope field, enter the value to adjust the production slope
after peak production. The slope
is the rate at which the curve changes. For example a normal
curve declines gradually at an average rate of 2% per week (this is
just an example). If a particular flock has a health issue and
the production is expected to decline at a much increased rate the
user could enter a value in the slope adjustment to increase the rate
at which the curve declines.
Hatch
- Hatch Pre Peak
represents the adjustment of hatchability that is required prior to
peak production. The factor is entered as a percentage. The screen
must be calculated for the data to be adjusted.
- Hatch Post Peak
represents the adjustment of hatchability that is required after peak
production. The factor is entered as a percentage. The screen must
be calculated for the data to be adjusted.
- In the Hatch
Slope field, enter the value to adjust the average hatchability
slope after the peak production. The
slope is the rate at which the curve changes. For example a
normal curve declines gradually at an average rate of 2% per week
(this is just an example). If a particular flock has a health
issue and the production is expected to decline at a much increased
rate the user could enter a value in the slope adjustment to increase
the rate at which the curve declines.
- Saleable Pre
Peak represents the adjustment of saleable chick percentage
that is required prior to peak production. The factor is entered as
a percentage. The screen must be calculated for the data to be adjusted.
- Saleable Post
Peak represents the adjustment of saleable chick percentage
that is required after peak production. The factor is entered as a
percentage. The screen must be calculated for the data to be adjusted.
- In the Saleable
Slope field, enter the value to adjust the average saleable
chick slope after the peak production. The
slope is the rate at which the curve changes. For example a
normal curve declines gradually at an average rate of 2% per week
(this is just an example). If a particular flock has a health
issue and the production is expected to decline at a much increased
rate the user could enter a value in the slope adjustment to increase
the rate at which the curve declines.
Head
- In the Re
Lay Head field, enter the number of head that will be used
for re-lay after the entity has been molted.
Statistics
The Statistics tab is read only and displays actual and projected statistical
data related to the production cycle of the entity.
The Adjustment section contains two sub-sections:
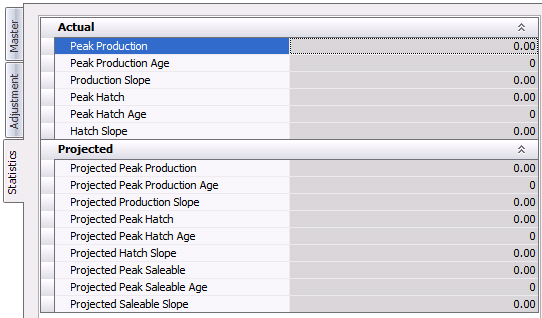
Actual
- Peak Production
indicates the highest percentage production for the entity.
- Peak Production
Age represents the age at which the entity attained the highest
production percentage.
- Production Slope
displays the slope of the percentage production.
- Peak Hatch
indicates the highest percentage hatch for the entity.
- Peak Hatch Age
represents the age at which the entity attained the highest percentage
hatch for the entity.
- Hatch Slope
displays the factor for the slope of the hatchability for the entity.
Projected
- Projected Peak
Production indicates the projected highest percentage production
for the entity.
- Projected Peak
Production Age represents the projected age at which the entity
will attain the highest production percentage.
- Projected Production
Slope displays the projected slope of the percentage production.
- Projected Peak
Hatch indicates the projected highest percentage production
for the entity.
- Projected Peak
Hatch Age represents the projected age at which the entity
will attain the highest percentage hatch for the entity.
- Projected Hatch
Slope displays the projected factor for the slope of the hatchability
for the entity.
- Projected Peak
Saleable indicates the projected highest percentage production
for the entity.
- Projected Peak
Saleable Age represents the projected age at which the entity
will attain the highest percentage saleable chicks for the entity.
- Projected Saleable
Slope displays the projected factor for the slope of the saleable
chicks for the entity.
Details
The Details section displays
the historical entity data from placement to end of lay. Data must be
imported using the import options.
The import will update the projected data with actual data from BIM. After
the new data has been imported then the flock must be calculated using
the button. Calculating after each import will re-project
the entity using the latest data statistics. Projected data lines
will be highlighted orange as a quick reference, displaying that
the lines are projected. The data includes statistical and cost
information.
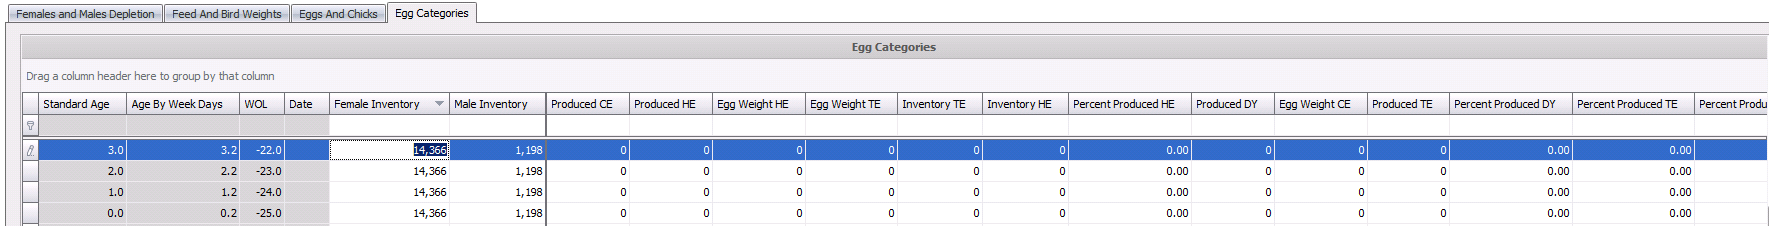
The Details section contains the following
components:
Females and
Males Depletion
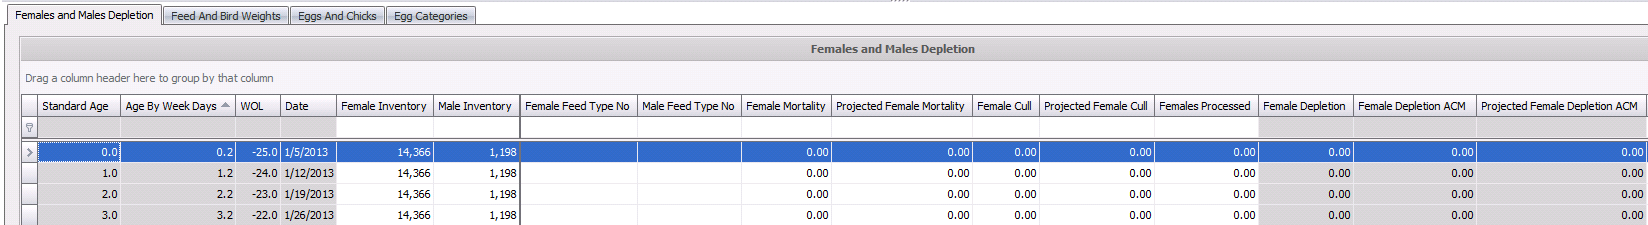
Feed and Bird Weights
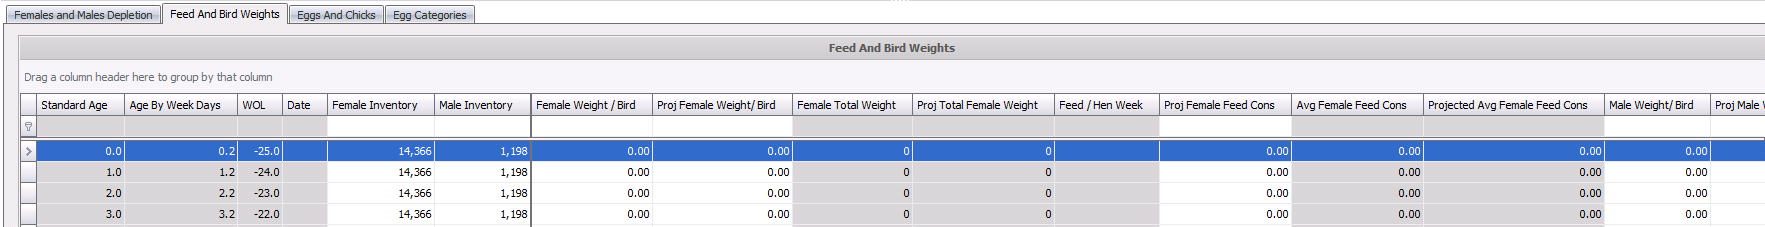
Eggs and Chicks
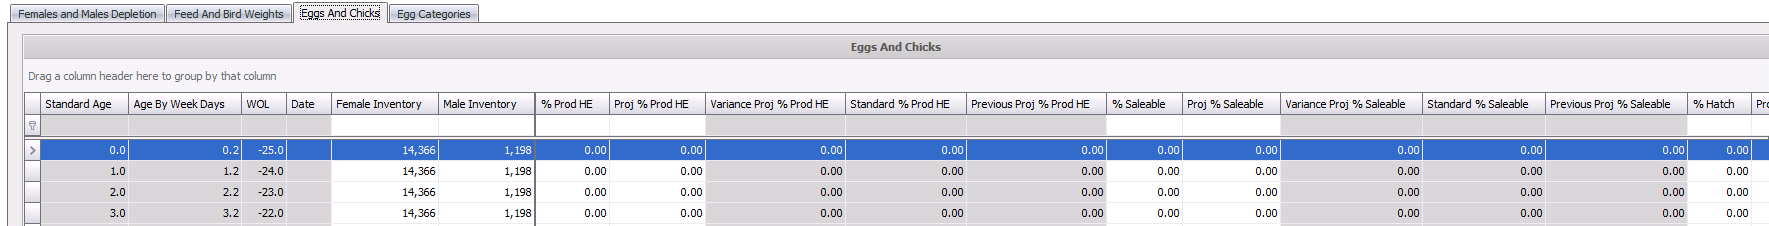
Egg Categories
Historical Fields for all Tabs:
Avg Female Feed Consumption |
Male Feed Price |
Projected Male Wt/Bird |
Avg Male Feed Consumption |
Male Feed Type No |
Projected Broilers |
Broiler Price |
Male Inventory |
Projected Hatch Eggs |
Chick Price |
Male Mortality |
Projected Saleable Chicks |
Egg Weight HE/TE/CE/DY |
Male Salvage Price |
Projected Total Chicks |
Feed/Hen Week |
Male Total Weight |
Production Days |
Feed/Male Week |
Male Weight/Bird |
Percent Produced HE/TE/CE/DY |
Female Cull |
Projected Avg Female Feed Consumption |
Previous Projected % Prod HE/Hatch |
Female Depletion |
Projected Avg Male Feed Consumption |
Produced HE/TE/CE/DY |
Female Depletion ACM |
Projected Female Consumption |
Proj % Prod HE |
Female Feed Price |
Projected Female Cull |
Proj % Saleable |
Female Feed Type No |
Projected Female Depletion |
Standard % Prod HE |
Female Inventory |
Projected Female Depletion ACM |
Standard % Saleable |
Female Mortality |
Projected Female Mortality |
Standard % Hatch |
Female Salvage Price |
Projected Female Total Wt |
Variance Proj % Hatch |
Female Total Weight |
Projected Female Wt/Bird |
Variance Proj % Prod HE |
Female Weight/Bird |
Projected Male Consumption |
Variance Proj % Saleable |
Hatch Egg Price |
Projected Male Cull |
Total Chicks |
Inventory HE/TE/CE/DY |
Projected Male Depletion |
Total Hatching Eggs |
Male Cull |
Projected Male Depletion ACM |
Total Saleable |
Male Depletion |
Projected Male Mortality |
% Hatch |
Male Depletion ACM |
Projected Male Total Wt |
% Prod HE |
|
|
% Saleable |
Charts
There are several charts available within the Entity History that provide
a visual picture of the data. Chart data can be added or removed
by right clicking on the chart and selecting the Hide/Show series option.
Flk Depl Pre Cap
Displays Actual, Projected and Standards related to Female and Male
depletion before the entity has been capitalized.
Flk Delp Post Cap
Displays Actual, Projected and Standards related to Female and Male
depletion after the entity has been capitalized.
Flk Perf Post Cap
Displays Actual, Projected and Standards related to Hatching Eggs, Percent
of Eggs Hatched, and Saleable Chicks after the entity has been capitalized.
Wgt & Feed Pre Cap
Displays Actual, Projected and Standards related to Female/Male
weights and Feed consumed for Female and Male before the entity has
been capitalized.
Wgt & Feed Post Cap
Displays Actual, Projected and Standards related to Female/Male
weights and Feed consumed for Female and Male after the entity has
been capitalized.
Cost
Displays costs related to the value of the Hatch Egg, Broiler Chick,
Saleable Chicks, Female and Male Feed Cost, and Female and Male Salvage
Cost.
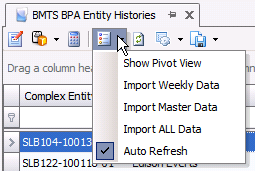
Options
There are two options available in the Menu:
Imports
In the Entity History Index screen, options are available for importing
BIM Data. Importing updates the Entity History with the most recent BIM
Data. In order to get accurate projections, imports should be done on
a regular basis.
- Click on the
 button to view
the import options.
button to view
the import options.
- Import Weekly
Data will import only the weekly transaction data pertaining
to the entity. This option should be used if adjustments have been
made to he flock.
- Import Master
Data will import only the header information pertaining to
the entity. This option should be used if BIM Master Data has
changed.
- Import All Data
will import all data, weekly transactions and header data. This option
should be used for a new entity; the first import.
- Auto Refresh
when checked will automatically update the index screen. If it is
,unchecked the refresh will have to be done manually by clicking on
the
 button.
* Note: While in the Index screen,
the entities that will be imported must be highlighted prior to importing.
Entities can be imported individually or all at the same time. To select
all entities, use the Ctrl + A keys to highlight all the entities and
then select the import option needed. To import an individual entity
just click on the entity to be imported and select the import option
needed.
Calculations
After the new data has been imported, the entities must be calculated
using the button. Calculating after each import
will re-project the entity using the latest data. Projected data
lines will be highlighted orange as a quick reference displaying that
the lines are projected. The data includes statistical and cost
information.
Molt Procedures
The details related to creating and transferring molt entities are outlined
in Transfers.
The following steps outline the process of molt entities in the BPA.
If the entity is molted and imported from the BIM:
- The source entity will be moved to the destination
molt entity using the 'molt movement' option.
- The Molt flag is checked on the destination molt
entity, therefore that flag will also be selected in the BPA Entity
History.
- The entity will use the corresponding standard
for the entity breed code that is selected as a molt standard. The
Molt flag is selected in BPA>Master
Data>Standard Versions.
- The date that the molt entity will start to produce
should be entered in the POL Date which aligns the standard to the
correct age. Note that this requires Registry> Growout>
BIM\LIM Growout> Point of Lay> Standard Age Basis must be set
to 'Point of Lay'.
If the molt entity is planned in the BPA:
- The planned molt entity is entered in BPA>
Planning> Movements with the entity number being set to the
new molted entity number.
- Select the Molt
flag to indicate that the entity is a molt entity.
- The entity will use the corresponding standard
for the entity breed code that is selected as a molt standard. The
Molt flag is selected in BPA>Master
Data>Standard Versions.
- Enter the POL Date in BPA>
Planning> Movements to align the entity to the correct age
in the standard. Note that this requires Registry> Growout>
BIM\LIM Growout> Point of Lay> Standard Age Basis must be set
to 'Point of Lay'.
Re-Mate Procedures
A re-mate entity is where the males are removed from the source
entity and replaced with males of a new breed. This will require a new
progeny product for the entity.
If the entity is re-mated and imported from BIM:
An entity is considered
re-mated if the Re-Mate flag is selected in BIM>Master
Data>Entities for the destination entity. The source entity
will be transferred in the BIM to the destination re-mated entity.
The best option is to transfer
the entity without history so that the past entities production data
is not available in the new entity and therefore not imported to the
BPA.
If required, update the re-mate
entity in BIM>Master Data>Entities using the Add/Change Entities
option with the new breed code and standard.
In Entity History, the Sold
Date of the source entity should be set to the re-mate date so stop
the source entity from continuing to produce planned egg production.
The destination re-mate entity
is added to the BPA Entity History and then the data is imported.
The re-mate entity will project
until the target sell age or the sale date if it is entered in Entity
History.
If the re-mate entity is planned in BPA:
The re-mate entity is entered
in BPA>Planning>Movements with the
new re-mate entity number.
Enter the Date
Moved In on the movement record to establish the date that
the re-mated entity will begin to lay hatching eggs.